 nolegirl24:
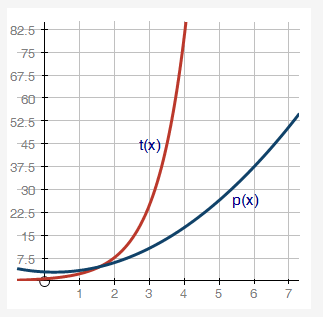
A quadratic function and an exponential function are graphed below. Which graph most likely represents the exponential function? graph of function t of x is a curve which joins the ordered pair 0, 1 and 1, 3 and 3, 27. Graph of function p of x is a curve which joins the ordered pair 0, 2 and 1, 3 and 3, 11 and 5, 27 and 6, 38 p(x), because an increasing exponential function will always exceeds an increasing quadratic function until their graphs intersect t(x), because an increasing quadratic function will always exceeds an increasing exponential function until their graphs intersect p(x), because an increasing quadratic function will eventually exceed an increasing exponential function t(x), because an increasing exponential function will eventually exceed an increasing quadratic function
nolegirl24:
Please!
 Hero:
Hero:
Hi @nolegirl24. Welcome to Question Cove. How can I assist you with this?
nolegirl24:
Haii. I can not figure out this problem and I do not understand it either. @Hero
Hero:
I have a question for you. Does the question specify which which functions is quadratic and which is exponential? If not that's okay.
nolegirl24:
I am not sure. Sorry
Hero:
That's okay, we'll go with what we've been given. Allow me to post a link to demos where we can work from.
nolegirl24:
Okay. Thank you.
Hero:
Okay, I plotted the first point. Do you think you can plot the next set of points for t(x)?
nolegirl24:
Uhh i have no idea what the point for t(x) would be because i am confused on this whole thing.
Hero:
The given points for t(x) are (0,1), (1,3), and (3, 27).
nolegirl24:
Okay, so i plot those down?
Hero:
Yes, go ahead and plot them on Desmos, thanks.
nolegirl24:
How would i do that?
Hero:
You just type them in one per line. I typed the first point in the data entry block on the left side of the screen. Do you see where I did that?
nolegirl24:
Okay, want me to plot the rest for t(x)
Hero:
Yes please :)
nolegirl24:
Okie :P
nolegirl24:
Done.
nolegirl24:
@Hero All done plotting the points.
Hero:
Okay, hit save, then copy/paste the link here.
nolegirl24:
I don't know where it says save. Do i have to sign in?
Hero:
Yes. Hopefully you have a Google account.
nolegirl24:
Okie, I do. Give me a second.
Hero:
Okay, good. Let me fix a few things real quick.
nolegirl24:
Alrighty
nolegirl24:
Link opened.
Hero:
Okay, so basically, all I did what make the points all the same color and correct something. You entered (3, 37) instead of (3,27). I assume that was a typo. Now that you know you to enter points, go ahead and enter all the points for p(x). See if you can do it in the same color. Preferably red.
nolegirl24:
Yeah it was a typo. Sorry about that. Plot the p(x) points on the graph you just gave me?
nolegirl24:
How do I know the points for p(x)?
Hero:
The points for p(x) are (0, 2), (1, 3), (3, 11), (5, 27), and (6, 38)
Hero:
Very good
nolegirl24:
Thanks. What next
Hero:
We must figure out which function is quadratic and which is exponential.
nolegirl24:
Alright.
Hero:
There is a particular method to use to do this
nolegirl24:
Graphing method?
Hero:
No. I have already figured out which is which long ago though.
nolegirl24:
Oh
nolegirl24:
This is my last question but i cant figure out the answer still :(
nolegirl24:
t(x) is a straight line while p(x) is not.
Hero:
?? Are you sure about that? Explain your reasoning.
nolegirl24:
Btw this is the graph they gave me. https://learn.flvs.net/webdav/assessment_images/educator_algebraI_v21/09_10_part1_g12_q04.gif
Hero:
I don't have access to that
nolegirl24:
oh idk how else to show you
 nolegirl24:
There i got it
Hero:
Strange because this is what I got for t(x). It's definitely not a straight line: https://www.desmos.com/calculator/8yyavcexgp
nolegirl24:
idk :( they gave me that graph to go by.
Hero:
They're trying to show you that t(x) is the exponential function and it is rising much faster than p(x) the quadratic function.
nolegirl24:
Alright. So does that mean the answer is D?
Hero:
Yes, correct. Great job.
nolegirl24:
Thank you!! <3
nolegirl24:
The answer was correct :) Thank you again!
Hero:
There is a way to figure out how to graph each of them. That would help you with answering these.
nolegirl24:
I got a 93% on the assignment. Thank you @Hero
Hero:
Great job on your assignment.
nolegirl24:
Thank you <3
Join our real-time social learning platform and learn together with your friends!
 Bounty:
the world keeps moving fast and I'm stuck in a time lapse all I need is a minute
Bounty:
can I get so tips on how to start my journey into semi-realism art also on how to
Bounty:
the world keeps moving fast and I'm stuck in a time lapse all I need is a minute
Bounty:
can I get so tips on how to start my journey into semi-realism art also on how to
 Strawberryluna:
Read my poem. Im not for criticism its a poem I wrote after my breakup: Youu2019ll never understand the way you made me break, I hate that I still love you
Bounty:
first poem in a min- (tittle)? one moment i'm fine I smile till my face burns I laugh till I cant breath Then I cry I wonder where I went wrong I listen to
Strawberryluna:
Read my poem. Im not for criticism its a poem I wrote after my breakup: Youu2019ll never understand the way you made me break, I hate that I still love you
Bounty:
first poem in a min- (tittle)? one moment i'm fine I smile till my face burns I laugh till I cant breath Then I cry I wonder where I went wrong I listen to
 Twaylor:
3d printing a glider (for 150 pound 5'8 person - prolly should make it for up to
Twaylor:
3d printing a glider (for 150 pound 5'8 person - prolly should make it for up to
 cullenn:
pitter patter sound of rain gently tapping my window tonight. calming, soothing, right? not for me.
cullenn:
pitter patter sound of rain gently tapping my window tonight. calming, soothing, right? not for me.

 Arriyanalol:
DON'T BUY TICKETS TO SEAWORLD i watched a documentary on seaworld and its sad wha
Arriyanalol:
DON'T BUY TICKETS TO SEAWORLD i watched a documentary on seaworld and its sad wha
 natalieee:
who else wants a job in biology? I love biomedical science and want to work with
natalieee:
who else wants a job in biology? I love biomedical science and want to work with