Ask
your own question, for FREE!
Mathematics
6 Online
 nolegirl24:
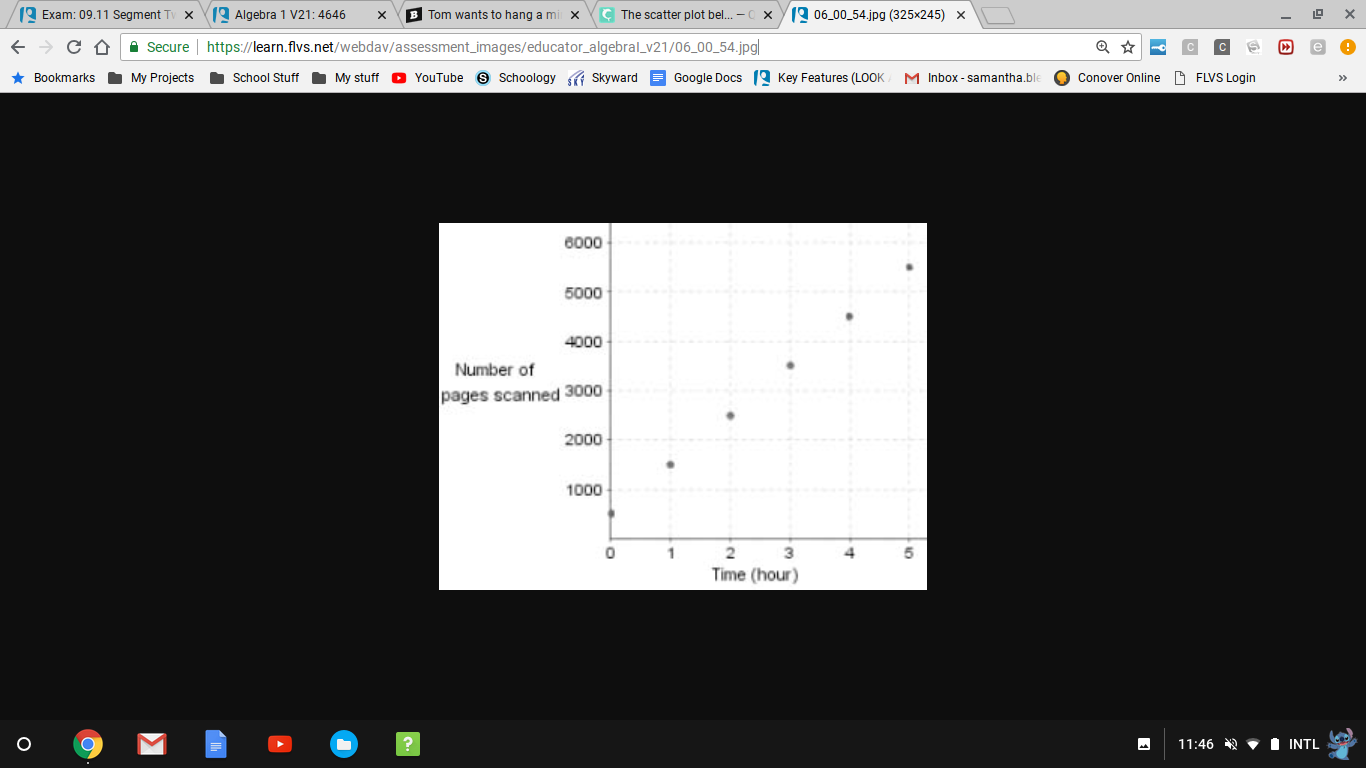
The scatter plot below shows the number of pages scanned (y) in different number of hours (x) by a scanning machine: Which function best represents the data shown in the scatter plot? y = 100 + 1,000x y = 100 − 1,000x y = 500 − 1,000x y = 500 + 1,000x
Still Need Help?
Join the QuestionCove community and study together with friends!
 nolegirl24:
@dude
 dude:
dude:
First off we can just look at the points, is it going up or down?
nolegirl24:
It is going up
dude:
Right so we can delete B and C, negative slopes go down
Still Need Help?
Join the QuestionCove community and study together with friends!
nolegirl24:
True
dude:
Now look where x = 0
What does the y value look to be?

nolegirl24:
500 right?
dude:
Yes
dude:
Out of A and D, which has 500 in their equation?
Still Need Help?
Join the QuestionCove community and study together with friends!
nolegirl24:
D
dude:
Ye
nolegirl24:
Okay, now this whole thing makes sense
nolegirl24:
Thanks Dude
dude:
Of course
Still Need Help?
Join the QuestionCove community and study together with friends!
nolegirl24:
You are really helpful
Can't find your answer?
Make a FREE account and ask your own questions, OR help others and earn volunteer hours!
Join our real-time social learning platform and learn together with your friends!
Join our real-time social learning platform and learn together with your friends!
Latest Questions
 Bounty:
the world keeps moving fast and I'm stuck in a time lapse all I need is a minute
Bounty:
can I get so tips on how to start my journey into semi-realism art also on how to
Bounty:
the world keeps moving fast and I'm stuck in a time lapse all I need is a minute
Bounty:
can I get so tips on how to start my journey into semi-realism art also on how to
 Strawberryluna:
Read my poem. Im not for criticism its a poem I wrote after my breakup: Youu2019ll never understand the way you made me break, I hate that I still love you
Bounty:
first poem in a min- (tittle)? one moment i'm fine I smile till my face burns I laugh till I cant breath Then I cry I wonder where I went wrong I listen to
Strawberryluna:
Read my poem. Im not for criticism its a poem I wrote after my breakup: Youu2019ll never understand the way you made me break, I hate that I still love you
Bounty:
first poem in a min- (tittle)? one moment i'm fine I smile till my face burns I laugh till I cant breath Then I cry I wonder where I went wrong I listen to
 Twaylor:
3d printing a glider (for 150 pound 5'8 person - prolly should make it for up to
Twaylor:
3d printing a glider (for 150 pound 5'8 person - prolly should make it for up to
 cullenn:
pitter patter sound of rain gently tapping my window tonight. calming, soothing, right? not for me.
cullenn:
pitter patter sound of rain gently tapping my window tonight. calming, soothing, right? not for me.
 Arriyanalol:
DON'T BUY TICKETS TO SEAWORLD i watched a documentary on seaworld and its sad wha
Arriyanalol:
DON'T BUY TICKETS TO SEAWORLD i watched a documentary on seaworld and its sad wha
 natalieee:
who else wants a job in biology? I love biomedical science and want to work with
natalieee:
who else wants a job in biology? I love biomedical science and want to work with
Bounty:
the world keeps moving fast and I'm stuck in a time lapse all I need is a minute
2 days ago
1 Reply
0 Medals
Bounty:
can I get so tips on how to start my journey into semi-realism art also on how to
1 week ago
0 Replies
0 Medals
Strawberryluna:
Read my poem. Im not for criticism its a poem I wrote after my breakup: Youu2019ll never understand the way you made me break, I hate that I still love you
1 week ago
4 Replies
2 Medals
Bounty:
first poem in a min- (tittle)? one moment i'm fine I smile till my face burns I laugh till I cant breath Then I cry I wonder where I went wrong I listen to
1 week ago
5 Replies
1 Medal
Twaylor:
3d printing a glider (for 150 pound 5'8 person - prolly should make it for up to
1 week ago
5 Replies
0 Medals
cullenn:
pitter patter sound of rain gently tapping my window tonight. calming, soothing, right? not for me.
1 week ago
2 Replies
0 Medals
 Arriyanalol:
DON'T BUY TICKETS TO SEAWORLD i watched a documentary on seaworld and its sad wha
Arriyanalol:
DON'T BUY TICKETS TO SEAWORLD i watched a documentary on seaworld and its sad wha
3 weeks ago
2 Replies
1 Medal
natalieee:
who else wants a job in biology? I love biomedical science and want to work with
3 weeks ago
9 Replies
0 Medals