 Nevey:
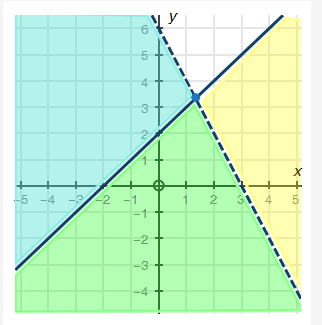
The graph below represents which system of inequalities? (graph in comments) The graph below represents which system of inequalities? (graph in comments) y < −2x + 6 y ≤ x + 2 y ≤ −2x + 6 y < x + 2 y < 2 over 3x − 2 y ≥ 2x + 2 None of the above
 Nevey:
@AP @Kamauri
 jhonyy9:
do you know how you get where is defined a system of inequalities ?
jhonyy9:
@ThisGirlPretty any idea for help here ?
Nevey:
i might, but you would need to show me an example for me to remember. i knew how to do a math thing (i forgot what its called (again) and then i saw an example and was like wait i know this and laughed at my idioticity)
Nevey:
@dude
jhonyy9:
first of all you need calcule the zeros of a system of inequalities after this you need drawn the diagramm to see where in what interval will be defined this system
Nevey:
the first 2 are wrong. A and B. so it has to be C or D
Nevey:
wait actually that might be wrong 1 sec i have to check something
jhonyy9:
than you check this diagramm you see that for x=0 need getting y=2 so you need first getting a system where one of these inequalities has this zero for x=0 result y=2 ok ?
Nevey:
C is wrong
jhonyy9:
and a second zero of this system need being for X=3 to get y=0 do you see these ?
Nevey:
i think its A. what do u think?
jhonyy9:
than you check can being A or B how finish this ?
Nevey:
do u think its a yes or no? i just worked it out and i think its A
jhonyy9:
why A ? in case of B the zeros are 2 and 3 too just you need seeing the graph line where is continue what mean this ?
jhonyy9:
so this mean that where you see line continue like in case of x=0 result y=2 so this mean that y can getting the value of 2 but in this second zero of 3 where the line not is continue do you see it ? so this mean that x not can being equal 3 need being law or greater than 3 hope is clearly
Nevey:
its a. the answer is a.
Join our real-time social learning platform and learn together with your friends!
 Bounty:
the world keeps moving fast and I'm stuck in a time lapse all I need is a minute
Bounty:
can I get so tips on how to start my journey into semi-realism art also on how to
Bounty:
the world keeps moving fast and I'm stuck in a time lapse all I need is a minute
Bounty:
can I get so tips on how to start my journey into semi-realism art also on how to
 Strawberryluna:
Read my poem. Im not for criticism its a poem I wrote after my breakup: Youu2019ll never understand the way you made me break, I hate that I still love you
Bounty:
first poem in a min- (tittle)? one moment i'm fine I smile till my face burns I laugh till I cant breath Then I cry I wonder where I went wrong I listen to
Strawberryluna:
Read my poem. Im not for criticism its a poem I wrote after my breakup: Youu2019ll never understand the way you made me break, I hate that I still love you
Bounty:
first poem in a min- (tittle)? one moment i'm fine I smile till my face burns I laugh till I cant breath Then I cry I wonder where I went wrong I listen to
 Twaylor:
3d printing a glider (for 150 pound 5'8 person - prolly should make it for up to
Twaylor:
3d printing a glider (for 150 pound 5'8 person - prolly should make it for up to
 cullenn:
pitter patter sound of rain gently tapping my window tonight. calming, soothing, right? not for me.
cullenn:
pitter patter sound of rain gently tapping my window tonight. calming, soothing, right? not for me.

 Arriyanalol:
DON'T BUY TICKETS TO SEAWORLD i watched a documentary on seaworld and its sad wha
Arriyanalol:
DON'T BUY TICKETS TO SEAWORLD i watched a documentary on seaworld and its sad wha
 natalieee:
who else wants a job in biology? I love biomedical science and want to work with
natalieee:
who else wants a job in biology? I love biomedical science and want to work with