 Razor:
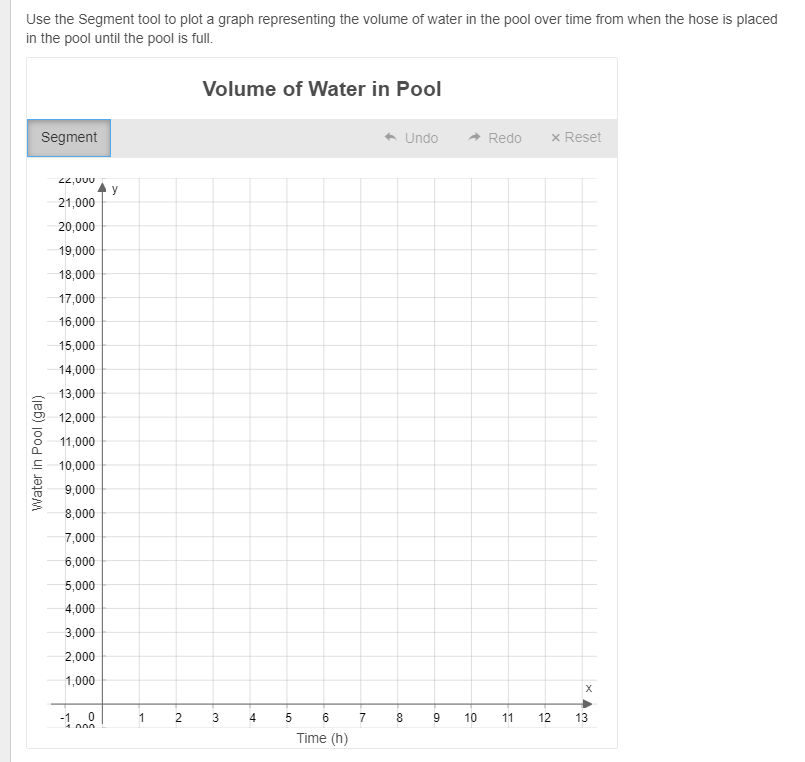
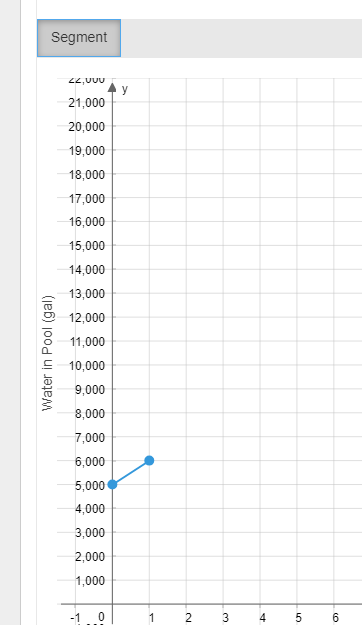
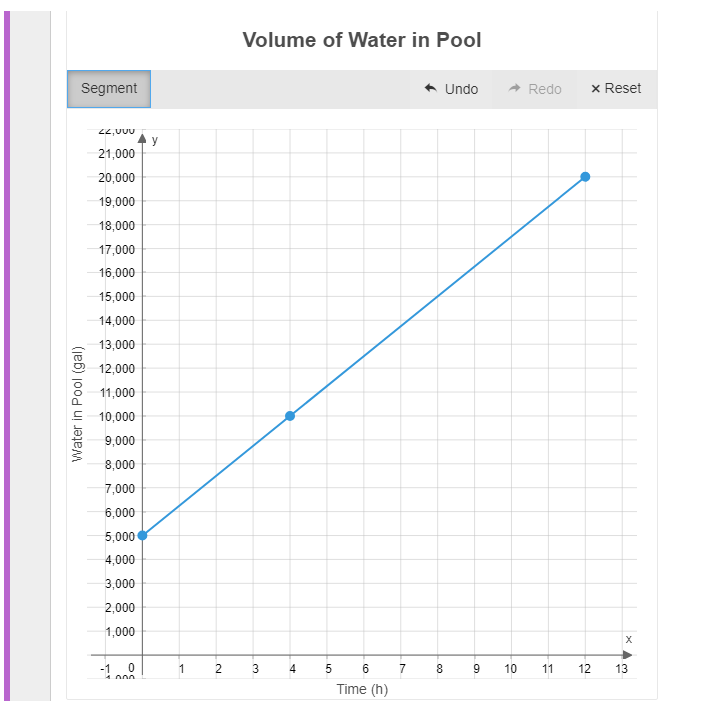
A 20,000 gallon swimming pool contains 5000 gallons of water when a hose is placed in the pool and begins adding water at a rate of 1250 gallons per hour.
 jhonyy9:
Razor any idea ? you need creat a function with variable x what f(x) will start from 5000 do you understand me ?
Razor:
No I don't understand any of it I missed the class for this lesson....
jhonyy9:
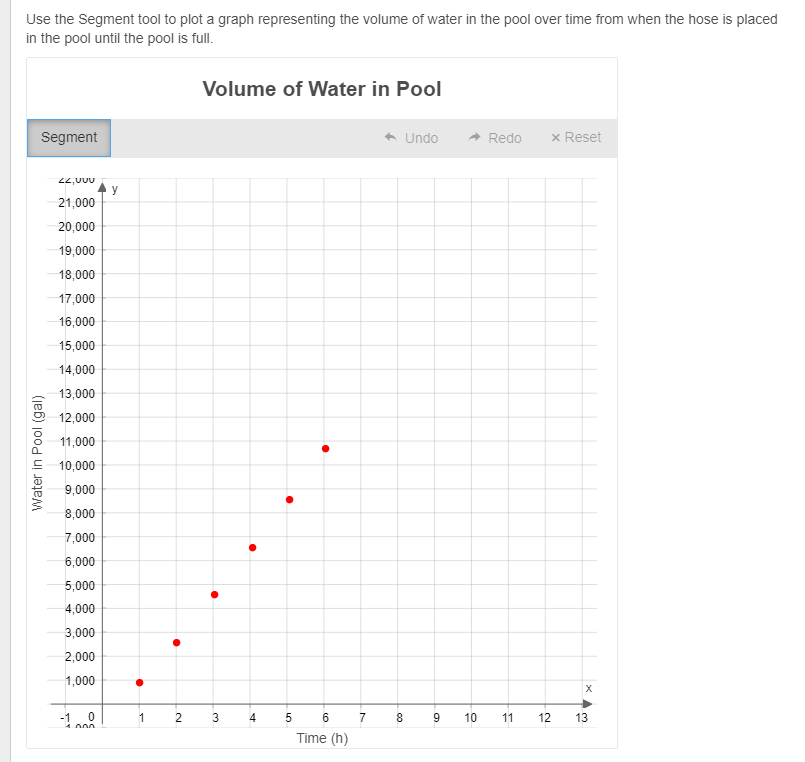
you know that f(0) = 5000 gallon and after every hours the pool get 1250 gallon water so after the first hour the pool contain 5000 +1250 gallon water = 6250 gallon after second hour the pool contain 6250+1250 = 7500 gallon water do you understand me ?
Razor:
ohhhh....so I just keep adding 1250 because its like ...per hour?
jhonyy9:
@ThisGirlPretty yes exactly
jhonyy9:
and using this you ned make a diagramm
jhonyy9:
need
jhonyy9:
it's ok now ?
Razor:
erm....do we use rise and run?
jhonyy9:
@ThisGirlPretty can you please help in explain it ?
Razor:
lolz.....sorry dewd
jhonyy9:
the diagramm start from point f(0) = 5000 so y = 5000 after 1 hour so x=1 the y=5000+1250 = 6250 and so much continue
jhonyy9:
when x=2 so y = 7500
Razor:
..............................................................maybe I should use khan academy o-o or wait for dude o-o
jhonyy9:
why ? just us what i ve wrote above and drawn the diagramm till the pool will be full arive at 20000 gallon of water
jhonyy9:
@ThisGirlPretty please can you explaining more understandably ?
Razor:
one sec I'm gonna see if I can do it and show you
jhonyy9:
Razor this diagramm is very very easy just us what i ve wrote above
 Razor:
Or do you mean diagram like a shape
jhonyy9:
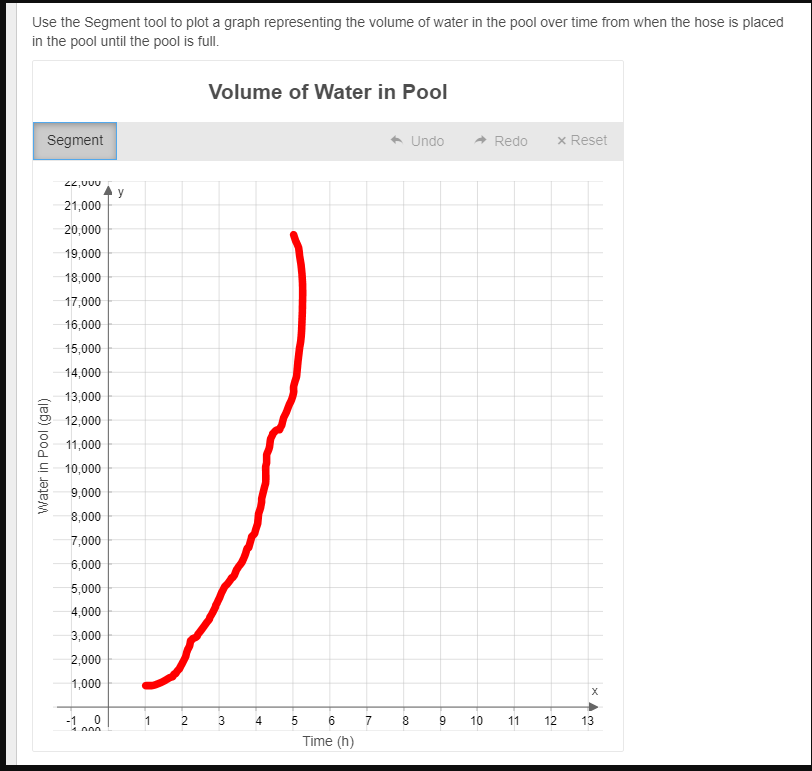
no just a line a curve
Razor:
ohhh
 Razor:
I def didn't do it right
 dude:
dude:
Oh, its not exponential, its linear
Razor:
o-o ...but howz I dew dis
dude:
So jhonny said that when x is 0, the y is 5,000 So 5,000 is your starting points
jhonyy9:
exactly dude - thank you thet help in explaination
Razor:
ohhhhh
Razor:
okie okie
dude:
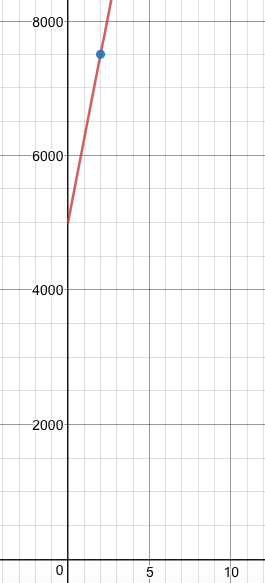
`1250 gallons per hour.` This is your rate (rise/run) per is like saying over (a fraction) So, 1250 \(\color{red}{per}\) hour =>\(\frac{1250}{hour}=>\frac{1250}{1}\)
Razor:
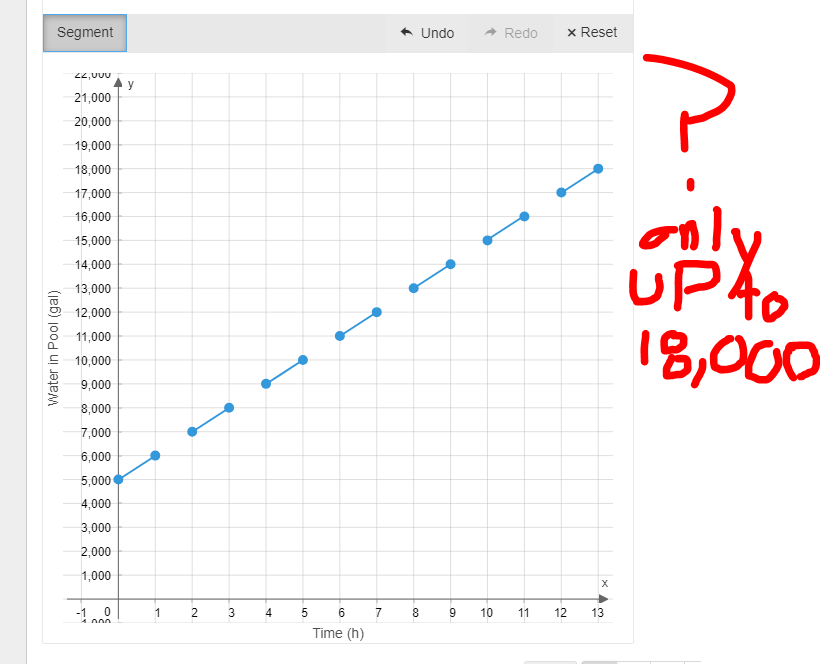
..... I'm guessing I'm going to stop my line at 4 hours... and then continue going up from there?
dude:
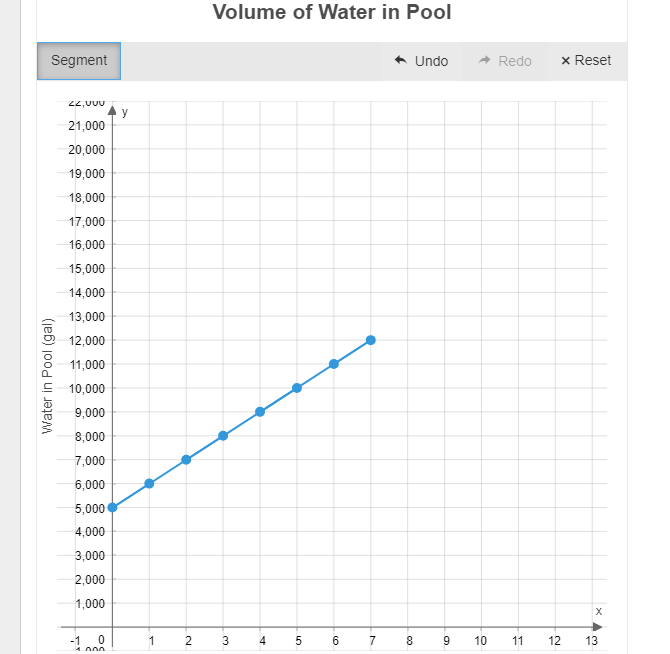
Add 1250 each time to get your next point
 That is a rough estimate, I only plotted the first hour
dude:
Starting = 5,000 Point 1 = 5,000+1250 = 6250 Point 2 = 6250 + 1250 = 7500 and so on...
Razor:
oh so I literally start ON the line..
dude:
Yes
 Razor:
Like that and then so on?
dude:
to to the next point, just add 1250
dude:
When re-check your point
dude:
Unless you are actually at 6250
 dude:
dude:
Oh, hmm can you plot points on 3 different locations? Or does it have to be every x value has a point?
 dude:
dude:
No no, I mean like only have a point for example when x is 2
Razor:
ohhh no it doesn't let me do that
dude:
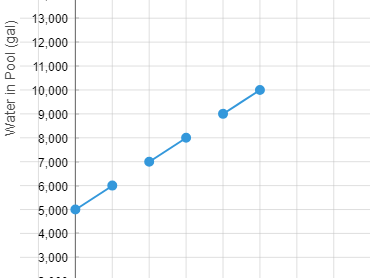
Welp, I guess the way you were doing it is right though it isn't technically right Every point is supposed to go up by 1250, not 1000
Razor:
lolz ... okie I can't make it go that little or far though
dude:
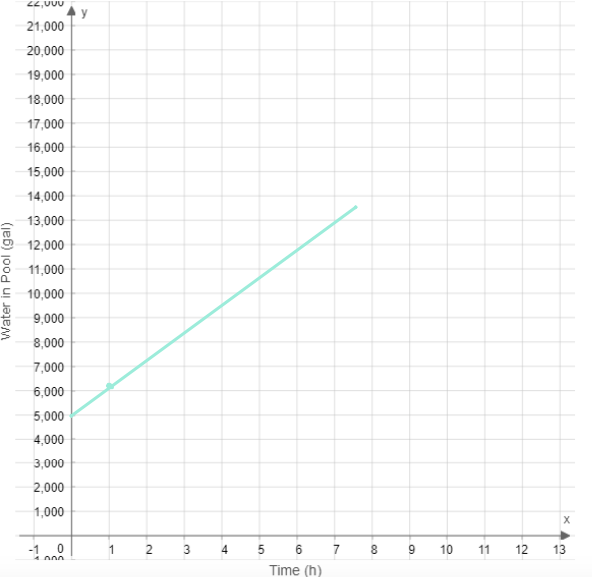
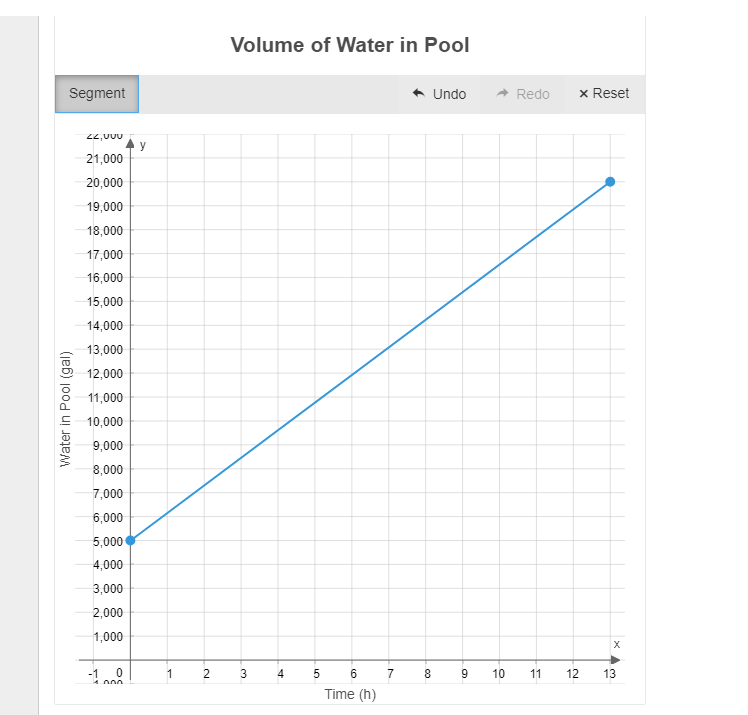
You're only supposed to go up to when y is 20,000, since that is the capacity of the gallon
 dude:
dude:
Up to 20,000 Also its a straight line, there are no jumps
 Razor:
Ah I got it
dude:
Oh wait you can play specific points
Razor:
??
dude:
You want to post these main ones 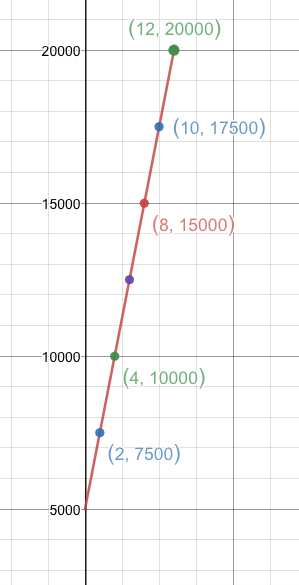
dude:
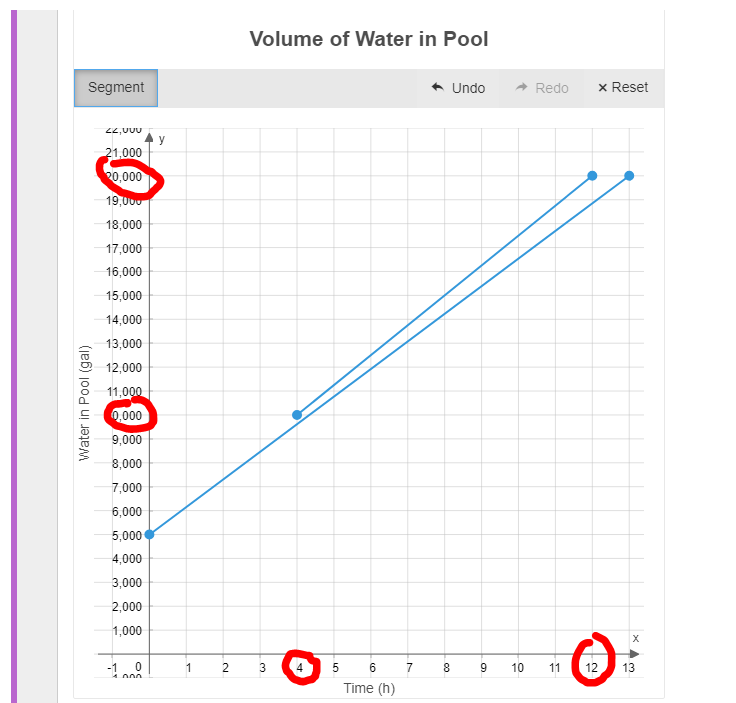
Oh it only goes up by 10,000 Only plot (4, 10000) and (12, 20000)
Razor:
ah okie XD
dude:
Yes
Razor:
errrrr points all look wonky
dude:
How so?
 dude:
dude:
You don't need the other line The points in your answer should only be (0, 5000) (4, 10000) (12, 20000)
 Razor:
Took way longer than I thought
dude:
Perf
dude:
Yes sorry
Razor:
XD iz fine my fault
dude:
D: Well that is your graph
Razor:
okiez.. do yew think yew could stay on for more math questions?
dude:
Sure
Razor:
okie thanks
Join our real-time social learning platform and learn together with your friends!
 Bounty:
the world keeps moving fast and I'm stuck in a time lapse all I need is a minute
Bounty:
can I get so tips on how to start my journey into semi-realism art also on how to
Bounty:
the world keeps moving fast and I'm stuck in a time lapse all I need is a minute
Bounty:
can I get so tips on how to start my journey into semi-realism art also on how to
 Strawberryluna:
Read my poem. Im not for criticism its a poem I wrote after my breakup: Youu2019ll never understand the way you made me break, I hate that I still love you
Bounty:
first poem in a min- (tittle)? one moment i'm fine I smile till my face burns I laugh till I cant breath Then I cry I wonder where I went wrong I listen to
Strawberryluna:
Read my poem. Im not for criticism its a poem I wrote after my breakup: Youu2019ll never understand the way you made me break, I hate that I still love you
Bounty:
first poem in a min- (tittle)? one moment i'm fine I smile till my face burns I laugh till I cant breath Then I cry I wonder where I went wrong I listen to
 Twaylor:
3d printing a glider (for 150 pound 5'8 person - prolly should make it for up to
Twaylor:
3d printing a glider (for 150 pound 5'8 person - prolly should make it for up to
 cullenn:
pitter patter sound of rain gently tapping my window tonight. calming, soothing, right? not for me.
cullenn:
pitter patter sound of rain gently tapping my window tonight. calming, soothing, right? not for me.

 Arriyanalol:
DON'T BUY TICKETS TO SEAWORLD i watched a documentary on seaworld and its sad wha
Arriyanalol:
DON'T BUY TICKETS TO SEAWORLD i watched a documentary on seaworld and its sad wha
 natalieee:
who else wants a job in biology? I love biomedical science and want to work with
natalieee:
who else wants a job in biology? I love biomedical science and want to work with