 Razor:
Catherine needs to sell boxes of cookies as a fundraiser for a team. She starts with 135 boxes and begins selling at a constant rate of 15 boxes each day. Use the Segment tool to plot a graph representing the number of boxes of cookies Catherine has left to sell from the time she begins selling until the cookies are gone.
 Razor:
@dude
 dude:
dude:
Same concept as the last question, what is the starting amount of boxes?
Razor:
135
dude:
Yes, so she is selling the boxes she has, so the line is going down
dude:
What is the rate of the line?
Razor:
15 per day?
dude:
Right
dude:
So start subtracting 15 from every point to get your line Start from 135
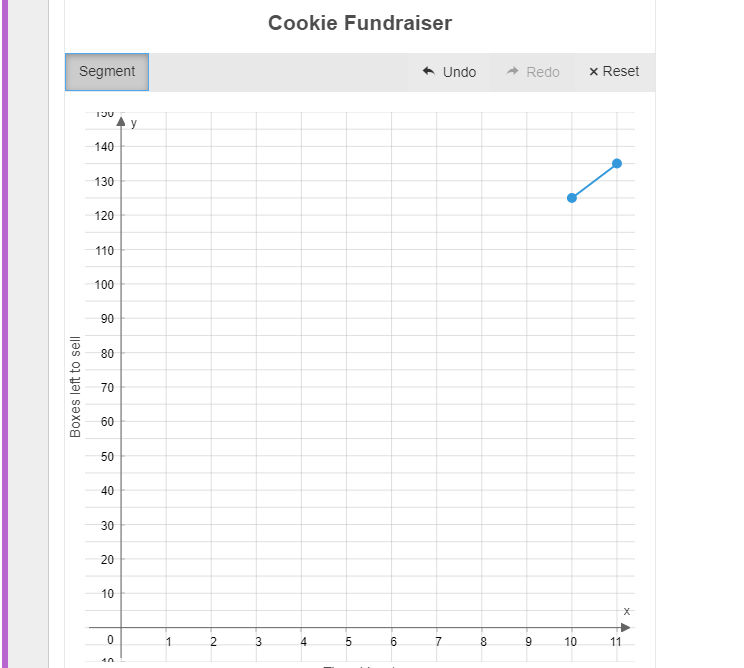 Razor:
Like that...?
dude:
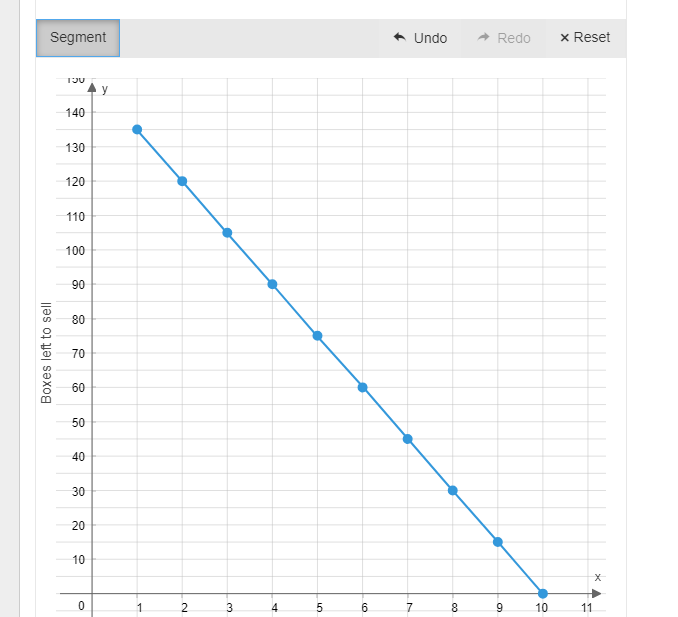
Oh, I think in all these graphs, you're starting on the line on the left side
dude:
For this one you're definitely starting on the line to the left
dude:
|dw:1542237619160:dw| Supposed to look somewhat like this
Razor:
ohhh
 Razor:
I'll take away the little points but yeah like dissssssssssss
dude:
The line iteself is right, but you're starting on the y-axis
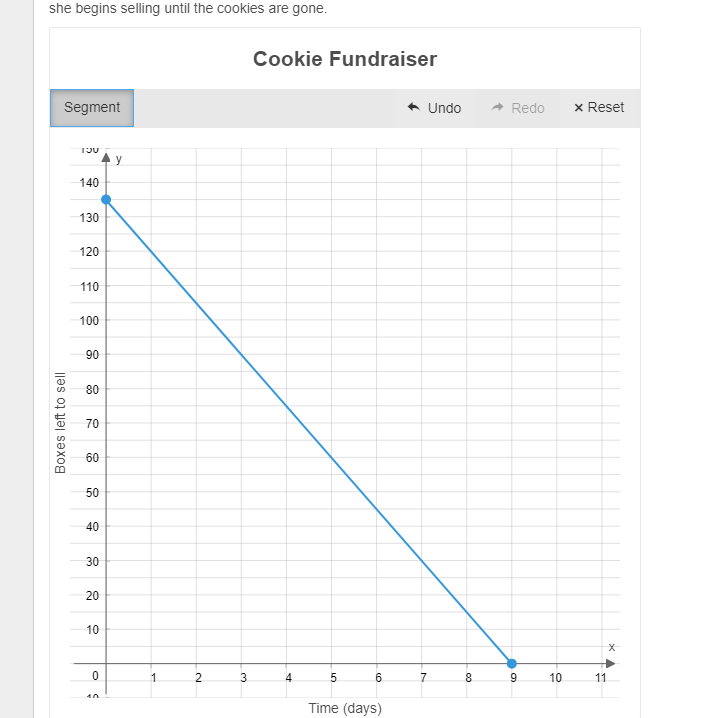 Razor:
boom
dude:
Looks right!
Razor:
So I can use that o-o
dude:
Yes
 Eiwoh2:
Where are le replies
Join our real-time social learning platform and learn together with your friends!
 Bounty:
the world keeps moving fast and I'm stuck in a time lapse all I need is a minute
Bounty:
can I get so tips on how to start my journey into semi-realism art also on how to
Bounty:
the world keeps moving fast and I'm stuck in a time lapse all I need is a minute
Bounty:
can I get so tips on how to start my journey into semi-realism art also on how to
 Strawberryluna:
Read my poem. Im not for criticism its a poem I wrote after my breakup: Youu2019ll never understand the way you made me break, I hate that I still love you
Bounty:
first poem in a min- (tittle)? one moment i'm fine I smile till my face burns I laugh till I cant breath Then I cry I wonder where I went wrong I listen to
Strawberryluna:
Read my poem. Im not for criticism its a poem I wrote after my breakup: Youu2019ll never understand the way you made me break, I hate that I still love you
Bounty:
first poem in a min- (tittle)? one moment i'm fine I smile till my face burns I laugh till I cant breath Then I cry I wonder where I went wrong I listen to
 Twaylor:
3d printing a glider (for 150 pound 5'8 person - prolly should make it for up to
Twaylor:
3d printing a glider (for 150 pound 5'8 person - prolly should make it for up to
 cullenn:
pitter patter sound of rain gently tapping my window tonight. calming, soothing, right? not for me.
cullenn:
pitter patter sound of rain gently tapping my window tonight. calming, soothing, right? not for me.

 Arriyanalol:
DON'T BUY TICKETS TO SEAWORLD i watched a documentary on seaworld and its sad wha
Arriyanalol:
DON'T BUY TICKETS TO SEAWORLD i watched a documentary on seaworld and its sad wha
 natalieee:
who else wants a job in biology? I love biomedical science and want to work with
natalieee:
who else wants a job in biology? I love biomedical science and want to work with