 ReaganLily:
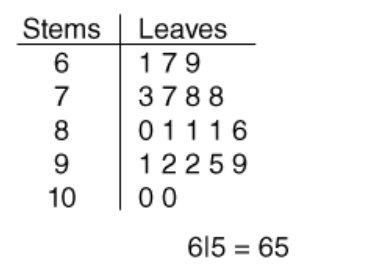
MULTIPLE Questions one plot! The following stem-and-leaf plot represents the scores earned by Mr. Roberts's class on their most recent science test. How many of the students scored less than a 75? 4 5 6 7 _________________________________________________________________________ The following stem-and-leaf plot represents the scores earned by Mr. Roberts's class on their most recent science test. What is the mode of the scores? 78 81 92 100 ___________________________________________________________________________ The following stem-and-leaf plot represents the scores earned by Mr. Roberts's class on their most recent science test. What is the median of the scores? 78 80 81 86 ____________________________________________________________________________ The following stem-and-leaf plot represents the scores earned by Mr. Roberts's class on their most recent science test. What is the range of the scores? 39 51 61 31 ______________________________________________________________________________
 dude:
dude:
The stem is the tens place 6 =60 7= 70 The leaf is the ones place 6 | 5 = 65
dude:
Multiple numbers just means more in that range 6 | 456 = 64, 65, 66
dude:
You want to count the ones below 75 Start with 73
Join our real-time social learning platform and learn together with your friends!
 Bounty:
the world keeps moving fast and I'm stuck in a time lapse all I need is a minute
Bounty:
can I get so tips on how to start my journey into semi-realism art also on how to
Bounty:
the world keeps moving fast and I'm stuck in a time lapse all I need is a minute
Bounty:
can I get so tips on how to start my journey into semi-realism art also on how to
 Strawberryluna:
Read my poem. Im not for criticism its a poem I wrote after my breakup: Youu2019ll never understand the way you made me break, I hate that I still love you
Bounty:
first poem in a min- (tittle)? one moment i'm fine I smile till my face burns I laugh till I cant breath Then I cry I wonder where I went wrong I listen to
Strawberryluna:
Read my poem. Im not for criticism its a poem I wrote after my breakup: Youu2019ll never understand the way you made me break, I hate that I still love you
Bounty:
first poem in a min- (tittle)? one moment i'm fine I smile till my face burns I laugh till I cant breath Then I cry I wonder where I went wrong I listen to
 Twaylor:
3d printing a glider (for 150 pound 5'8 person - prolly should make it for up to
Twaylor:
3d printing a glider (for 150 pound 5'8 person - prolly should make it for up to
 cullenn:
pitter patter sound of rain gently tapping my window tonight. calming, soothing, right? not for me.
cullenn:
pitter patter sound of rain gently tapping my window tonight. calming, soothing, right? not for me.

 Arriyanalol:
DON'T BUY TICKETS TO SEAWORLD i watched a documentary on seaworld and its sad wha
Arriyanalol:
DON'T BUY TICKETS TO SEAWORLD i watched a documentary on seaworld and its sad wha
 natalieee:
who else wants a job in biology? I love biomedical science and want to work with
natalieee:
who else wants a job in biology? I love biomedical science and want to work with