 rootbeer003:
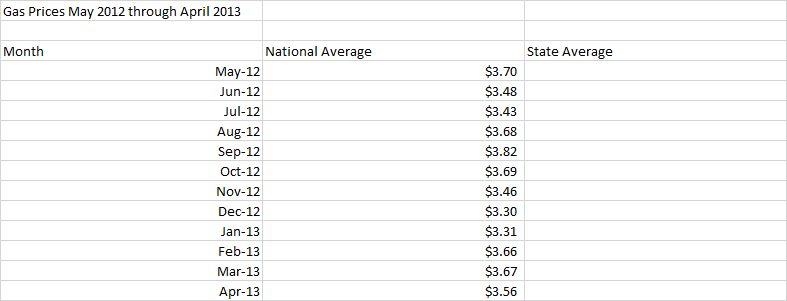
I'm really bad at excel, someone please help

 rootbeer003:
@Ultrilliam
 Ultrilliam:
Do you know how to edit a column?
rootbeer003:
Yes
Ultrilliam:
Which steps are you struggling with?
rootbeer003:
5
Ultrilliam:
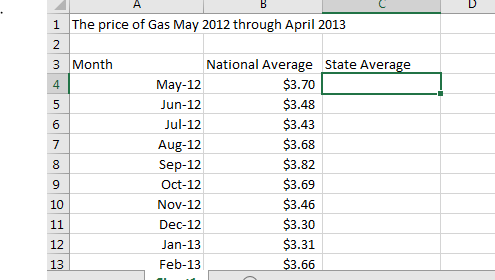
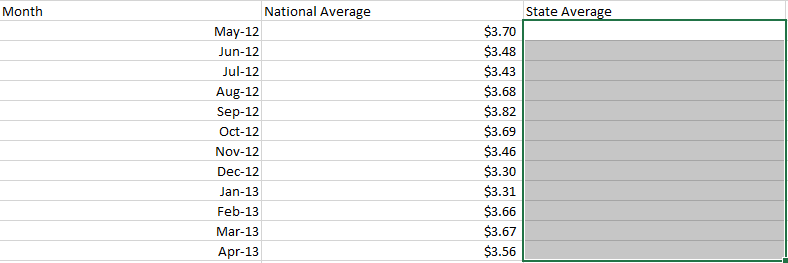
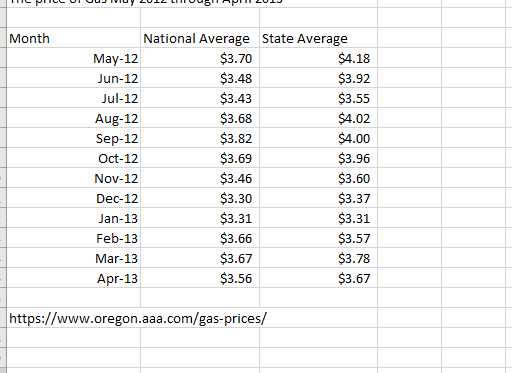
Well step one is you need to fill out the State Averages column so you have data, could you fill that out based on state averages? Here is an example of how it should look thus far:
 Ultrilliam:
Good, now fill out the state averages, from month to month
 Ultrilliam:
That is not quite what you need
rootbeer003:
O
Ultrilliam:
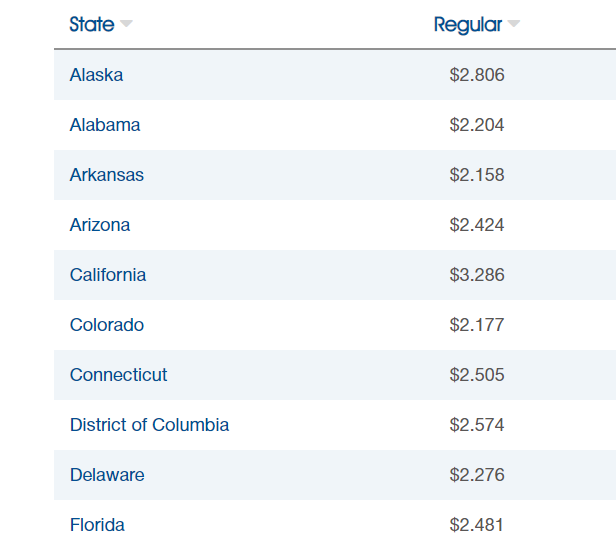
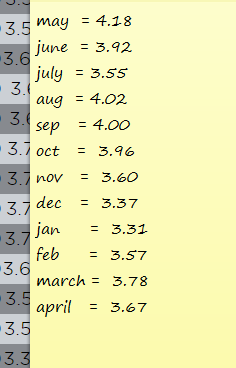
It's asking for May 2012 through April 2013 average state gas prices in YOUR state
rootbeer003:
OH
rootbeer003:
My state is Oregon, not sure how to find those prices
Ultrilliam:
You just need one number from each month between May 2012 through April 2013
Ultrilliam:
(Look at the state column, not the national column!)
rootbeer003:
okay ill do that right now, it might take awhile
Ultrilliam:
Alrighty
 rootbeer003:
ok
 Ultrilliam:
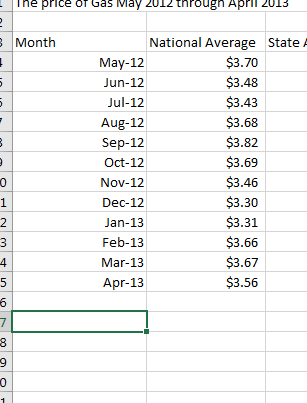
Perfect, do you know what column A17 would be?
 Ultrilliam:
That is correct, paste the link you got the data from there (https://www.oregon.aaa.com/gas-prices/)
 Ultrilliam:
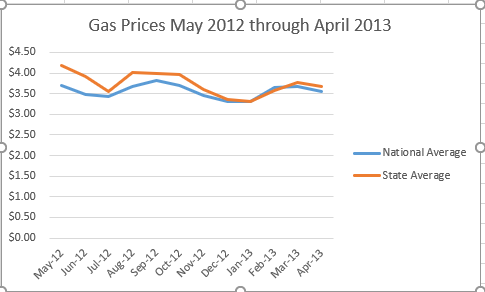
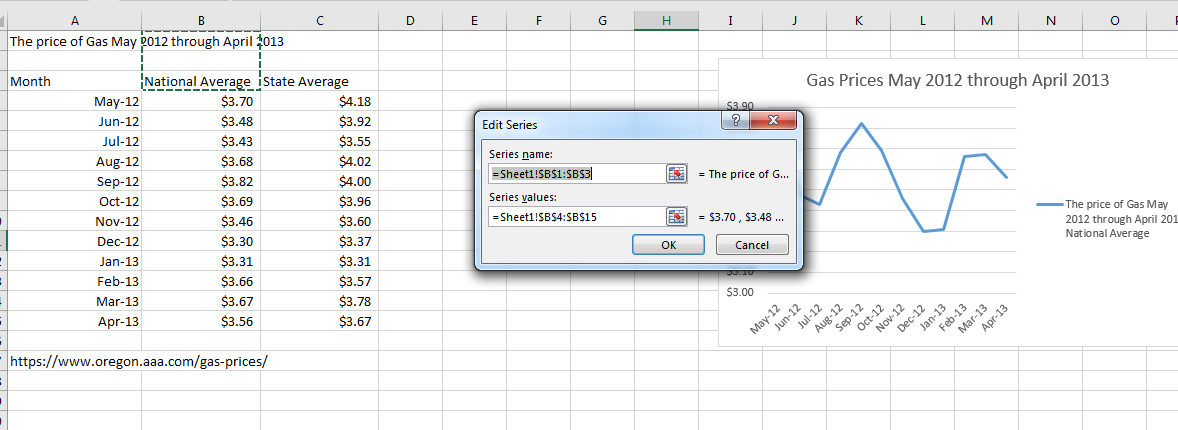
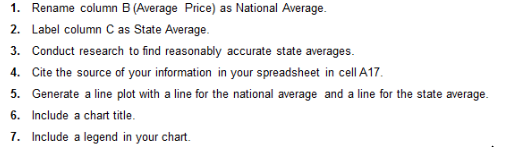
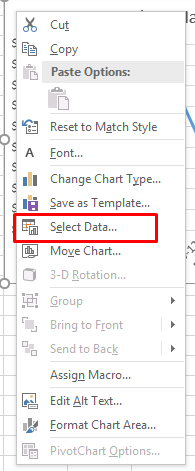
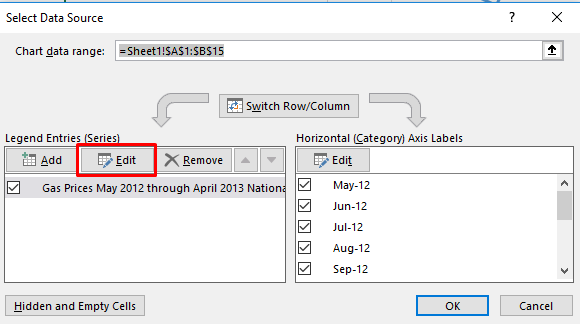
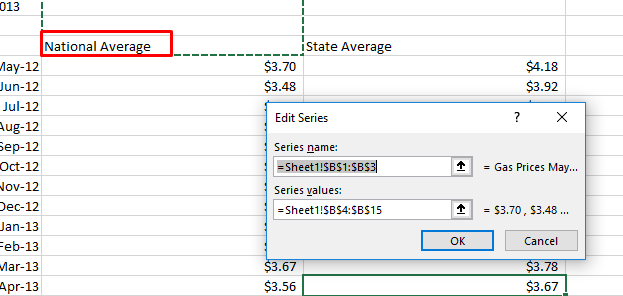
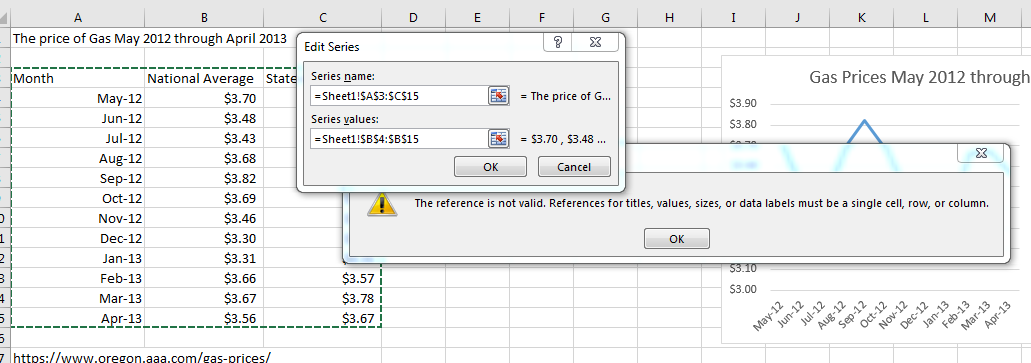
Perfect, next we're going to edit the chart data. First, we're going to change the title to just "Gas Prices May 2012 through April 2013", from there we're going to edit the data and legend of the chart. Right click on the chart and hit "Select Data" Select the first legend and hit "edit". Click the series name box and then click on "National Average"
 Ultrilliam:
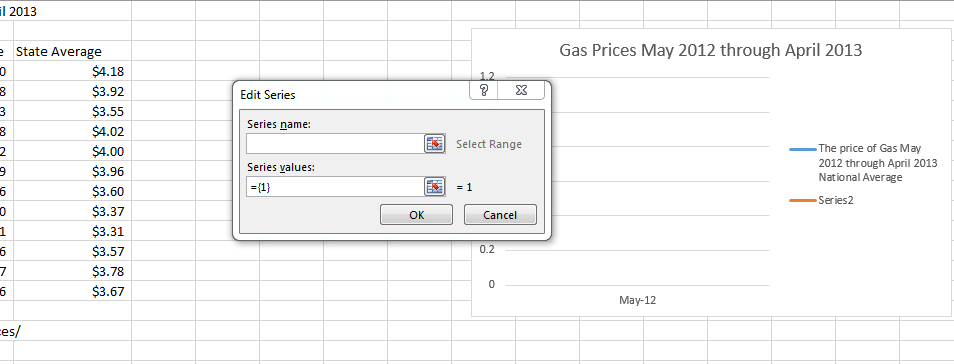
Next, we're going to add a new one, hit "add". For series name click on State Average, and for the data, hold shift and click and drag from C4-C15 and hit "ok"
 rootbeer003:
where does it say add
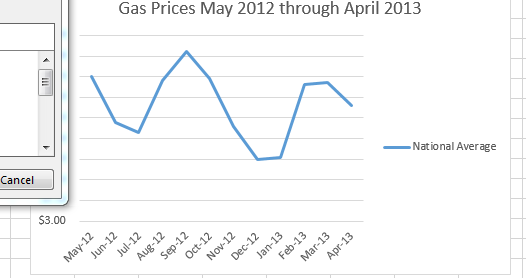
Ultrilliam:
Your at the step where you need to hit "National Average" (Column B3)
Ultrilliam:
After that hit "ok"
rootbeer003:
ok
 rootbeer003:
then i pressed add agaon
Ultrilliam:
I think you jumped around the steps I gave a bit...
rootbeer003:
Lol
rootbeer003:
i'll read over again
 Ultrilliam:
Better, but... Alright, lemme make this simpler instead of giving "the hard version" lol, after hitting Select Data, click and drag from A3 to C15
Ultrilliam:
(Sorry, brain-farted and forgot that you could do that)
 rootbeer003:
gottem
Ultrilliam:
There ya go, lol
Ultrilliam:
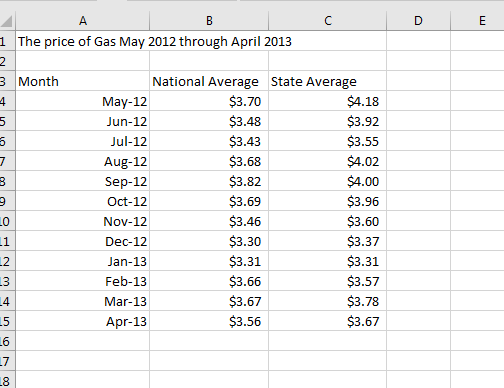
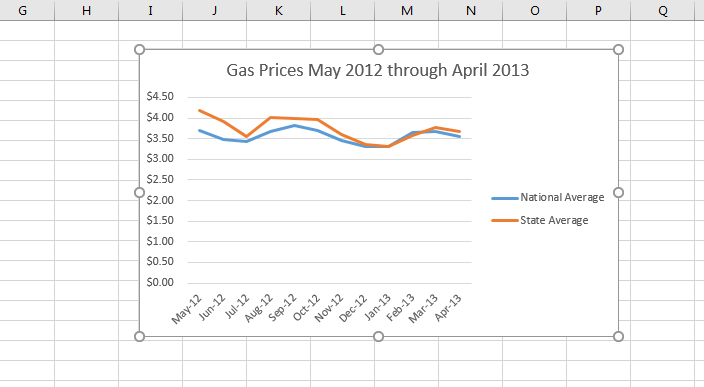
And with that, you should be done! Here's the one I did as we were going along with this.
 rootbeer003:
Perfect, thank u (:
Ultrilliam:
No problem!
rootbeer003:
There's one more assignment that adds onto the last one, working with charts
Join our real-time social learning platform and learn together with your friends!
 Bounty:
the world keeps moving fast and I'm stuck in a time lapse all I need is a minute
Bounty:
can I get so tips on how to start my journey into semi-realism art also on how to
Bounty:
the world keeps moving fast and I'm stuck in a time lapse all I need is a minute
Bounty:
can I get so tips on how to start my journey into semi-realism art also on how to
 Strawberryluna:
Read my poem. Im not for criticism its a poem I wrote after my breakup: Youu2019ll never understand the way you made me break, I hate that I still love you
Bounty:
first poem in a min- (tittle)? one moment i'm fine I smile till my face burns I laugh till I cant breath Then I cry I wonder where I went wrong I listen to
Strawberryluna:
Read my poem. Im not for criticism its a poem I wrote after my breakup: Youu2019ll never understand the way you made me break, I hate that I still love you
Bounty:
first poem in a min- (tittle)? one moment i'm fine I smile till my face burns I laugh till I cant breath Then I cry I wonder where I went wrong I listen to
 Twaylor:
3d printing a glider (for 150 pound 5'8 person - prolly should make it for up to
Twaylor:
3d printing a glider (for 150 pound 5'8 person - prolly should make it for up to
 cullenn:
pitter patter sound of rain gently tapping my window tonight. calming, soothing, right? not for me.
cullenn:
pitter patter sound of rain gently tapping my window tonight. calming, soothing, right? not for me.

 Arriyanalol:
DON'T BUY TICKETS TO SEAWORLD i watched a documentary on seaworld and its sad wha
Arriyanalol:
DON'T BUY TICKETS TO SEAWORLD i watched a documentary on seaworld and its sad wha
 natalieee:
who else wants a job in biology? I love biomedical science and want to work with
natalieee:
who else wants a job in biology? I love biomedical science and want to work with