 KittyGirl:
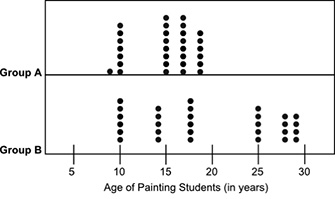
math help The dot plots below show the ages of students belonging to two groups of painting classes: Based on visual inspection, which group most likely has a lower mean age of painting students? Explain your answer using two or three sentences. Make sure to use facts to support your answer.
 KittyGirl:
@jhonyy9
 jhonyy9:
what is your opinion than you check this diagram ?
KittyGirl:
we'll im really bad with dot plots T.T but um I think the top one seems the lowest??
jhonyy9:
yes is right sure but why ?
KittyGirl:
well visually it looks like it has lowest for age and has less while the bottom one seems to have more
KittyGirl:
Is that right?
jhonyy9:
so bc. in group A the age of students there is between 8 and 19 when in case of group B the age of student there is between 10 and 28
jhonyy9:
yes you are right sure
jhonyy9:
ok. ?
KittyGirl:
ah oki
jhonyy9:
the next one please
KittyGirl:
alright
Group B is younger
Join our real-time social learning platform and learn together with your friends!
 Bounty:
the world keeps moving fast and I'm stuck in a time lapse all I need is a minute
Bounty:
can I get so tips on how to start my journey into semi-realism art also on how to
Bounty:
the world keeps moving fast and I'm stuck in a time lapse all I need is a minute
Bounty:
can I get so tips on how to start my journey into semi-realism art also on how to
 Strawberryluna:
Read my poem. Im not for criticism its a poem I wrote after my breakup: Youu2019ll never understand the way you made me break, I hate that I still love you
Bounty:
first poem in a min- (tittle)? one moment i'm fine I smile till my face burns I laugh till I cant breath Then I cry I wonder where I went wrong I listen to
Strawberryluna:
Read my poem. Im not for criticism its a poem I wrote after my breakup: Youu2019ll never understand the way you made me break, I hate that I still love you
Bounty:
first poem in a min- (tittle)? one moment i'm fine I smile till my face burns I laugh till I cant breath Then I cry I wonder where I went wrong I listen to
 Twaylor:
3d printing a glider (for 150 pound 5'8 person - prolly should make it for up to
Twaylor:
3d printing a glider (for 150 pound 5'8 person - prolly should make it for up to
 cullenn:
pitter patter sound of rain gently tapping my window tonight. calming, soothing, right? not for me.
cullenn:
pitter patter sound of rain gently tapping my window tonight. calming, soothing, right? not for me.

 Arriyanalol:
DON'T BUY TICKETS TO SEAWORLD i watched a documentary on seaworld and its sad wha
Arriyanalol:
DON'T BUY TICKETS TO SEAWORLD i watched a documentary on seaworld and its sad wha
 natalieee:
who else wants a job in biology? I love biomedical science and want to work with
natalieee:
who else wants a job in biology? I love biomedical science and want to work with