 bill533:
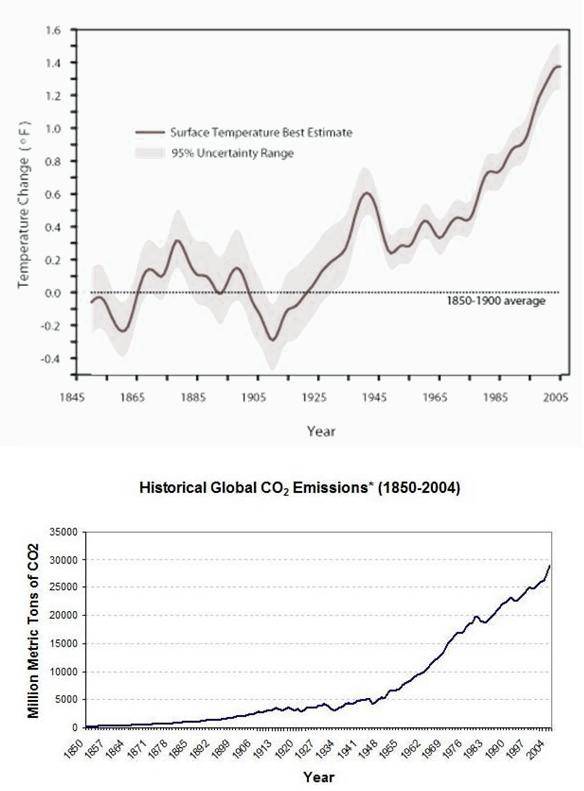
Analyze the relationship between CO2 emissions and surface temperature change between 1950 and 2000 using the data presented in the graphs. A) increase emissions leads to an increase of CO2 in the atmosphere which definitely causes the increase in temperature B) increase emissions leads to an increase of CO2 in the atmosphere which may be the cause of the increase in temperature C) increase emissions leads to a decrease of CO2 in the atmosphere which may be the cause of the increase in temperature D) increase emissions leads to an increase of CO2 in the atmosphere which may be the cause for the decrease in temperature
 bill533:
@Gdeinward
bill533:
Andy sets up an experiment with the goal of determining the coefficient of static friction between a wooden block and a wooden surface. He uses a spring scale to weigh a wooden block. He then places the block on a plane and inclines it until the block begins to slide. The angle of slip is recorded. Andy repeats the experiment using a variety of materials to cover the board. He recorded the data in a table. Andy did not distinguish between types of sandpaper. How would running two trials, one with fine sandpaper and another using coarse sandpaper, impact his results? A) Using both types will serve to confirm the accuracy of the sandpaper results already recorded. B) If his results are accurate, he would not expect any differences between the two sandpaper types. C) Andy would expect the coefficient of static friction to be consistent throughout all of the trials. D) If his results are accurate, he would expect a difference between the angle of slip, fine versus coarse.
![IMG_0627[1].JPG](https://assets.questioncove.com/attachments/1567541276-5d6ec5af72a186334c8cf800-IMG_0627%5B1%5D.JPG) bill533:
bill533:
what do you think
 Gdeinward:
i dont know on this one. Its something I haven't learned.
bill533:
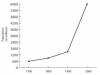
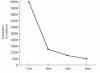
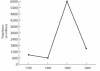
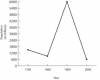
Year Population 1700 600,000,000 1800 900,000,000 1900 1,500,000,000 2000 6,000,000,000 The world population is shown in this data table. Which line graph BEST displays this data?
 bill533:
@Gdeinward
 Evo:
Evo:
just plot it dude
Join our real-time social learning platform and learn together with your friends!
 Bounty:
the world keeps moving fast and I'm stuck in a time lapse all I need is a minute
Bounty:
can I get so tips on how to start my journey into semi-realism art also on how to
Bounty:
the world keeps moving fast and I'm stuck in a time lapse all I need is a minute
Bounty:
can I get so tips on how to start my journey into semi-realism art also on how to
 Strawberryluna:
Read my poem. Im not for criticism its a poem I wrote after my breakup: Youu2019ll never understand the way you made me break, I hate that I still love you
Bounty:
first poem in a min- (tittle)? one moment i'm fine I smile till my face burns I laugh till I cant breath Then I cry I wonder where I went wrong I listen to
Strawberryluna:
Read my poem. Im not for criticism its a poem I wrote after my breakup: Youu2019ll never understand the way you made me break, I hate that I still love you
Bounty:
first poem in a min- (tittle)? one moment i'm fine I smile till my face burns I laugh till I cant breath Then I cry I wonder where I went wrong I listen to
 Twaylor:
3d printing a glider (for 150 pound 5'8 person - prolly should make it for up to
Twaylor:
3d printing a glider (for 150 pound 5'8 person - prolly should make it for up to
 cullenn:
pitter patter sound of rain gently tapping my window tonight. calming, soothing, right? not for me.
cullenn:
pitter patter sound of rain gently tapping my window tonight. calming, soothing, right? not for me.

 Arriyanalol:
DON'T BUY TICKETS TO SEAWORLD i watched a documentary on seaworld and its sad wha
Arriyanalol:
DON'T BUY TICKETS TO SEAWORLD i watched a documentary on seaworld and its sad wha
 natalieee:
who else wants a job in biology? I love biomedical science and want to work with
natalieee:
who else wants a job in biology? I love biomedical science and want to work with