 bill533:
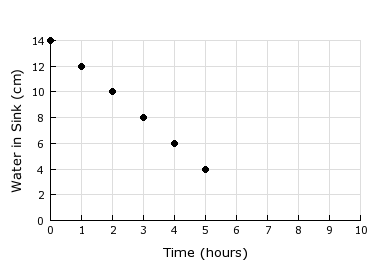
A man’s sink is clogged and draining slowly. He decides to measure how much water is left in the sink hourly to determine when it will empty. Based on the data in the graph, how long will it take all the water to drain? A) 6 hours B) 7 hours C) 8 hours D) 10 hours
 WhipStreak23:
Ok What kind of plot is this?
 Gdeinward:
look at the slope of the points and the pattern its following.
WhipStreak23:
No direct answers <_<
Gdeinward:
THeir allowed, as long as you explain it
WhipStreak23:
Wait
Gdeinward:
You cant just give direct answers you have to explain it
 Hero:
Hero:
Where does it say Direct Answers are allowed in the rules?
Hero:
Here's what the rules say: Always be sure to guide users to their answer rather than just giving it directly. We have zero tolerance for direct answers.
Gdeinward:
I didnt just give a direct answer.
Hero:
ZERO TOLERANCE FOR DIRECT ANSWERS
Gdeinward:
I provided an efficient explanation
bill533:
He explained like he did on other questions i had
WhipStreak23:
And I was here first anyways,
Gdeinward:
I have had dozens of users do the ssame thing. Why is it that I am the one that always gets tried for this?
bill533:
He didn't give no direct answers
Gdeinward:
actually no. you werent
WhipStreak23:
What kind of plot is this? Line plot, right?
Hero:
You started off giving the direct answer. I'm not going to argue with you about this. Here's also what the rules say: GUIDE THE USER TO THEIR ANSWER. In other words, make sure the user is doing some of the work.
Hero:
What you never do is do all the work for them. They must be involved in the work or else your approach to helping them is improper.
Gdeinward:
I thought so in the beginning, but I had people with a smart score of 70 tell me otherwise. You can understand my confusion
bill533:
by the way, it's a scatter plot @WhipStreak23
WhipStreak23:
I know what kind of plot it is. I'm not dumb.
WhipStreak23:
I'm helping you through the problem
WhipStreak23:
/Anyways, Does the scatter plot resemble something? Like a Linear Graphhhhh
Join our real-time social learning platform and learn together with your friends!
 Bounty:
the world keeps moving fast and I'm stuck in a time lapse all I need is a minute
Bounty:
can I get so tips on how to start my journey into semi-realism art also on how to
Bounty:
the world keeps moving fast and I'm stuck in a time lapse all I need is a minute
Bounty:
can I get so tips on how to start my journey into semi-realism art also on how to
 Strawberryluna:
Read my poem. Im not for criticism its a poem I wrote after my breakup: Youu2019ll never understand the way you made me break, I hate that I still love you
Bounty:
first poem in a min- (tittle)? one moment i'm fine I smile till my face burns I laugh till I cant breath Then I cry I wonder where I went wrong I listen to
Strawberryluna:
Read my poem. Im not for criticism its a poem I wrote after my breakup: Youu2019ll never understand the way you made me break, I hate that I still love you
Bounty:
first poem in a min- (tittle)? one moment i'm fine I smile till my face burns I laugh till I cant breath Then I cry I wonder where I went wrong I listen to
 Twaylor:
3d printing a glider (for 150 pound 5'8 person - prolly should make it for up to
Twaylor:
3d printing a glider (for 150 pound 5'8 person - prolly should make it for up to
 cullenn:
pitter patter sound of rain gently tapping my window tonight. calming, soothing, right? not for me.
cullenn:
pitter patter sound of rain gently tapping my window tonight. calming, soothing, right? not for me.

 Arriyanalol:
DON'T BUY TICKETS TO SEAWORLD i watched a documentary on seaworld and its sad wha
Arriyanalol:
DON'T BUY TICKETS TO SEAWORLD i watched a documentary on seaworld and its sad wha
 natalieee:
who else wants a job in biology? I love biomedical science and want to work with
natalieee:
who else wants a job in biology? I love biomedical science and want to work with