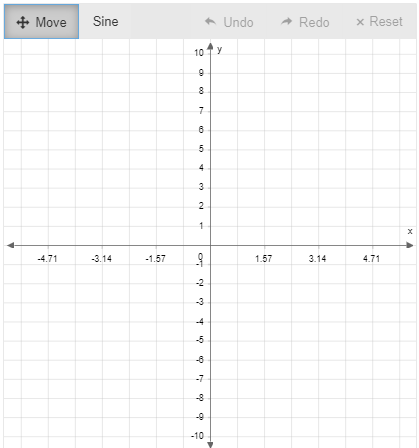
Graph a sine function whose amplitude is 4, period is π , midline is y=−3 , and y-intercept is (0, −3) . The graph is not a reflection of the parent function over the x-axis. Use the sine tool to graph the function. The first point must be on the midline and the second point must be a maximum or minimum value on the graph closest to the first point.
 dude:
dude:
Right so when you want to graph a sine function always start at the origin (unless its translated, in this case it went down 3 **Midline is -3 and y-intercept is 0,-3) Start at (0,-3) Now to know where you must put the maximum and minimum values you must know the period (which in this case is \(\pi\) Half of π is \(\frac{π}{2}\) so that is where the graph reaches the origin again |dw:1568755363515:dw| Now to find the max and minimum x values find half between the distance of 0 and \(\frac{π}{2}\) [Which is \(\frac{π}{4}\)] Amplitude tells you how far from the starting point it goes up/down, so the first max value is (\(\frac{π}{4},1\)), the first minimum value should be at y=-7 Between \(\frac{π}{2}\) and π, is the minimum, so add \(\frac{π}{4}\) to \(\frac{π}{2}\) [This is \(\frac{3π}{4}\)], this is your minimum value -- (\(\frac{3π}{4},-7\)) In the end you should get something like this https://www.desmos.com/calculator/ivcjo8jyi3
Join our real-time social learning platform and learn together with your friends!
 Bounty:
the world keeps moving fast and I'm stuck in a time lapse all I need is a minute
Bounty:
can I get so tips on how to start my journey into semi-realism art also on how to
Bounty:
the world keeps moving fast and I'm stuck in a time lapse all I need is a minute
Bounty:
can I get so tips on how to start my journey into semi-realism art also on how to
 Strawberryluna:
Read my poem. Im not for criticism its a poem I wrote after my breakup: Youu2019ll never understand the way you made me break, I hate that I still love you
Bounty:
first poem in a min- (tittle)? one moment i'm fine I smile till my face burns I laugh till I cant breath Then I cry I wonder where I went wrong I listen to
Strawberryluna:
Read my poem. Im not for criticism its a poem I wrote after my breakup: Youu2019ll never understand the way you made me break, I hate that I still love you
Bounty:
first poem in a min- (tittle)? one moment i'm fine I smile till my face burns I laugh till I cant breath Then I cry I wonder where I went wrong I listen to
 Twaylor:
3d printing a glider (for 150 pound 5'8 person - prolly should make it for up to
Twaylor:
3d printing a glider (for 150 pound 5'8 person - prolly should make it for up to
 cullenn:
pitter patter sound of rain gently tapping my window tonight. calming, soothing, right? not for me.
cullenn:
pitter patter sound of rain gently tapping my window tonight. calming, soothing, right? not for me.

 Arriyanalol:
DON'T BUY TICKETS TO SEAWORLD i watched a documentary on seaworld and its sad wha
Arriyanalol:
DON'T BUY TICKETS TO SEAWORLD i watched a documentary on seaworld and its sad wha
 natalieee:
who else wants a job in biology? I love biomedical science and want to work with
natalieee:
who else wants a job in biology? I love biomedical science and want to work with