 Ballery1:
Need math help
Ballery1:
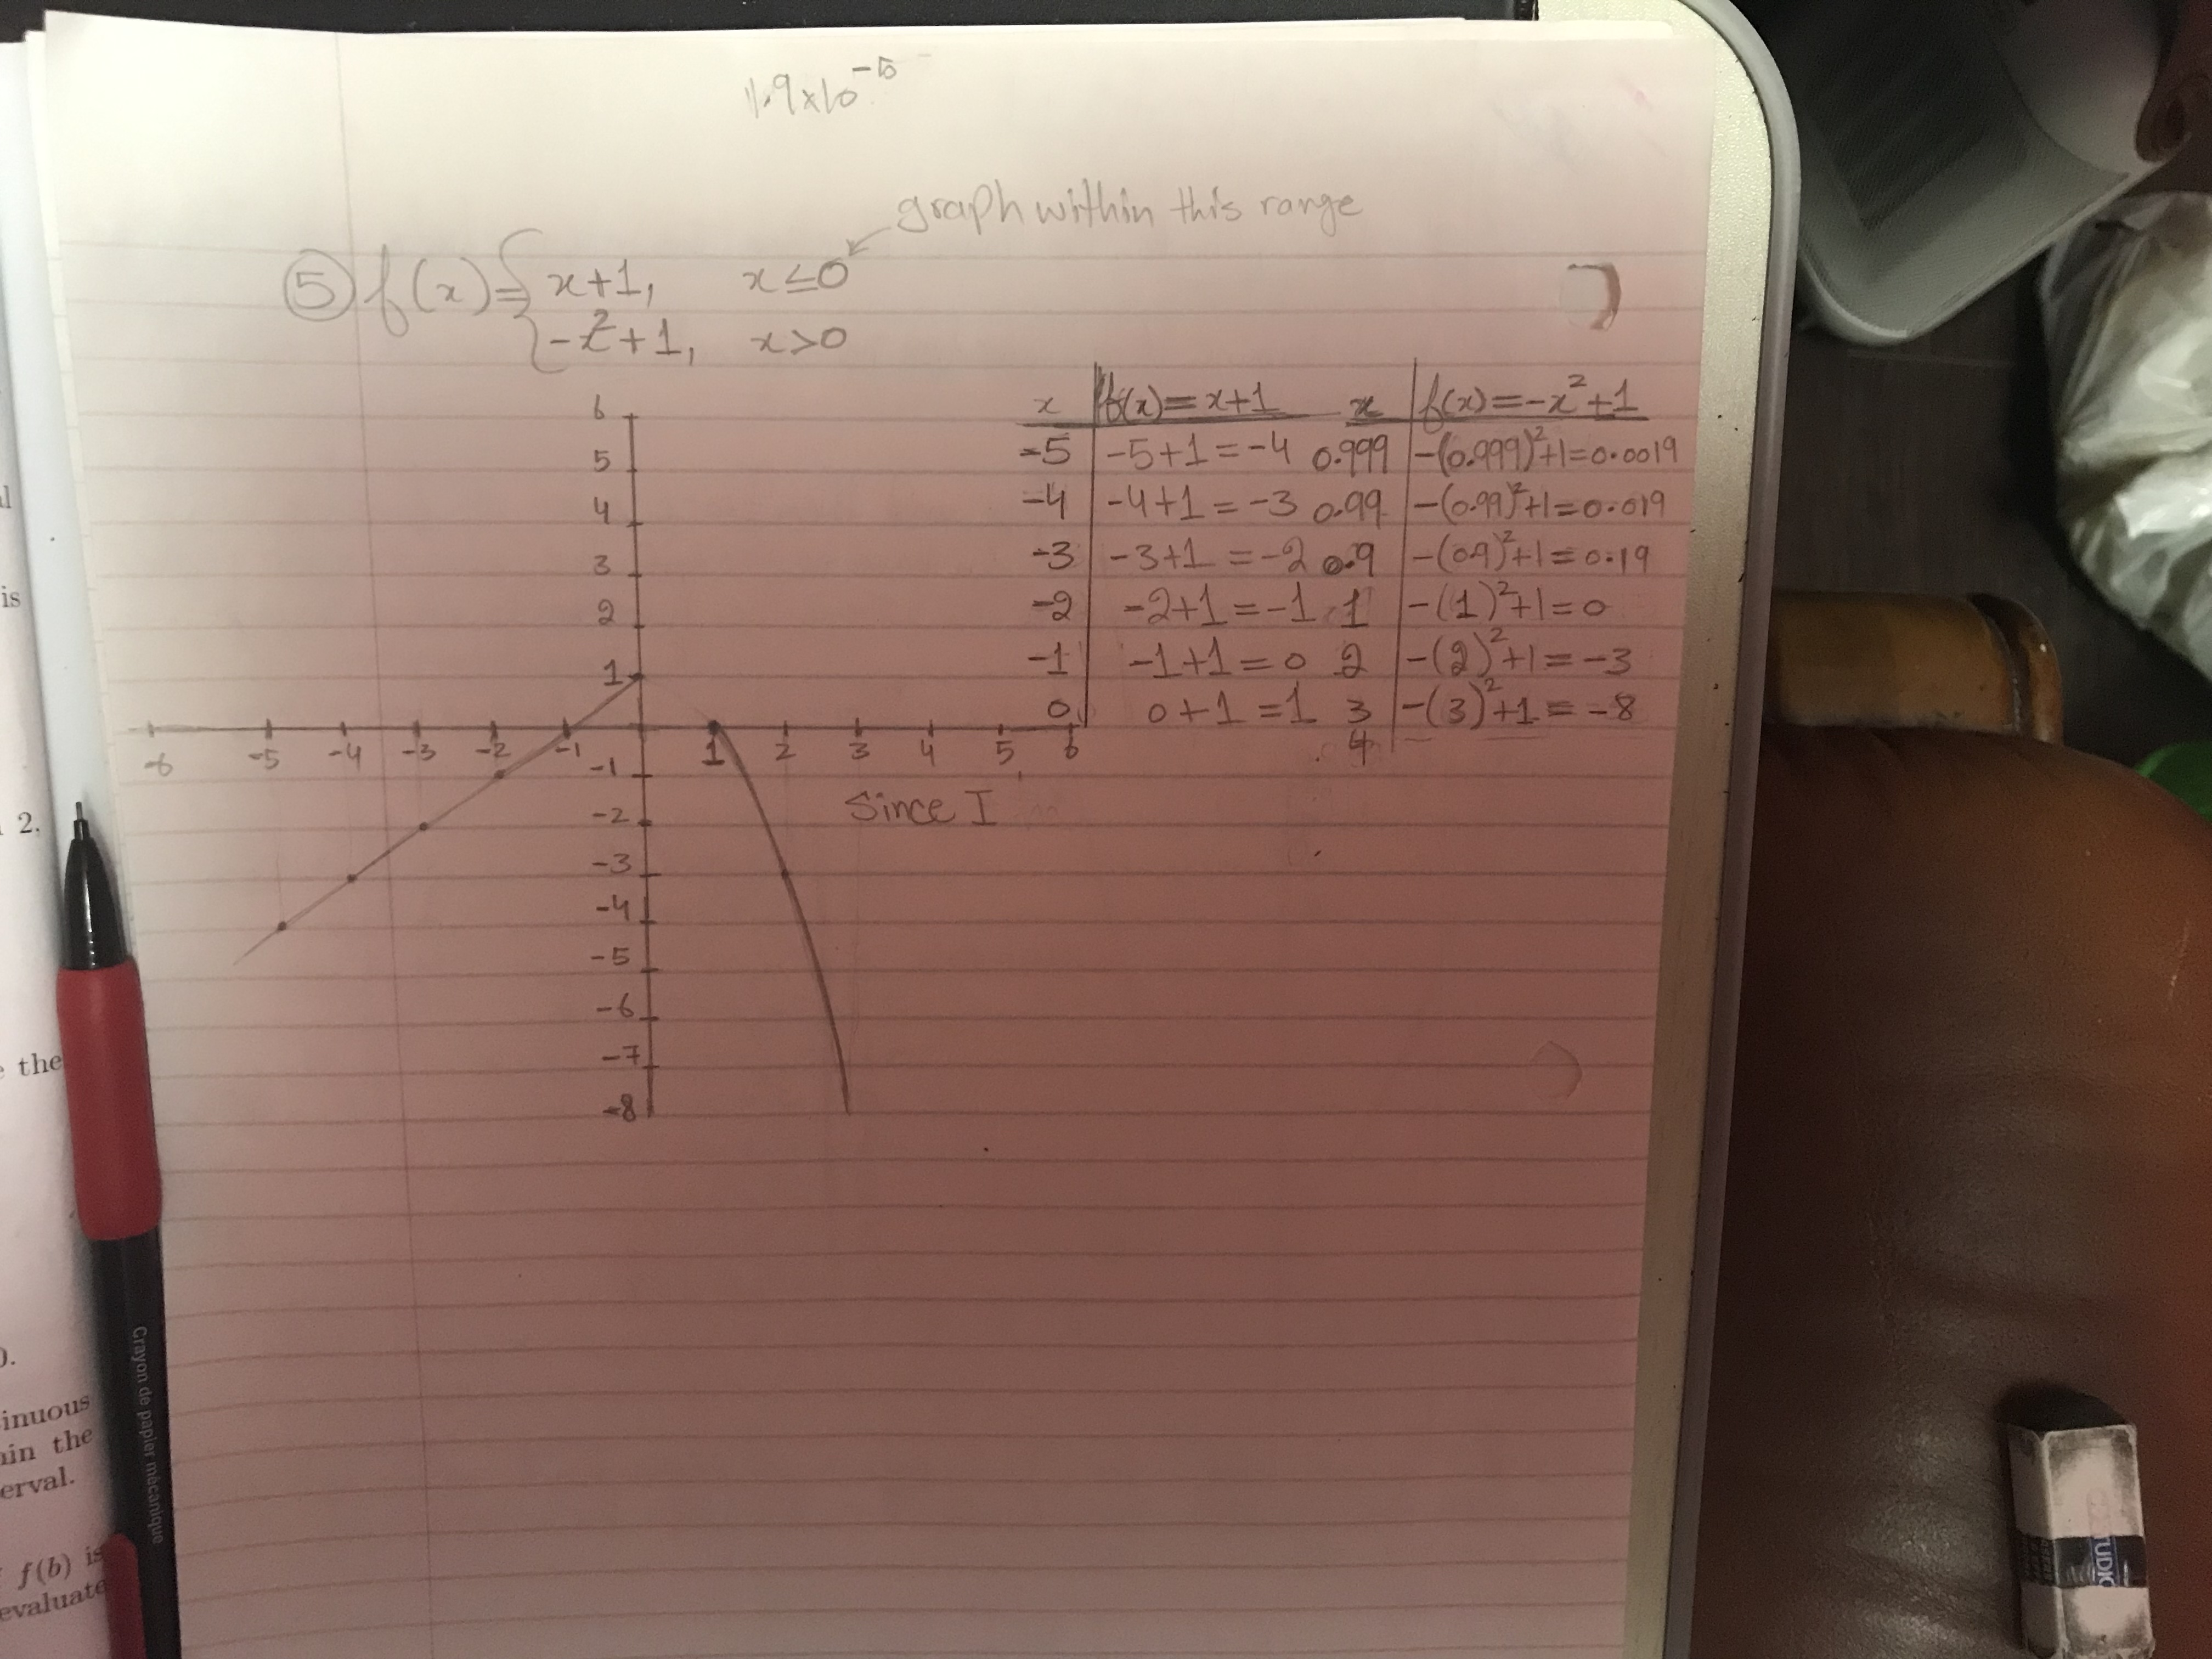
Can someone please draw this graph in geogebra for me? With restrictions?
Ballery1:
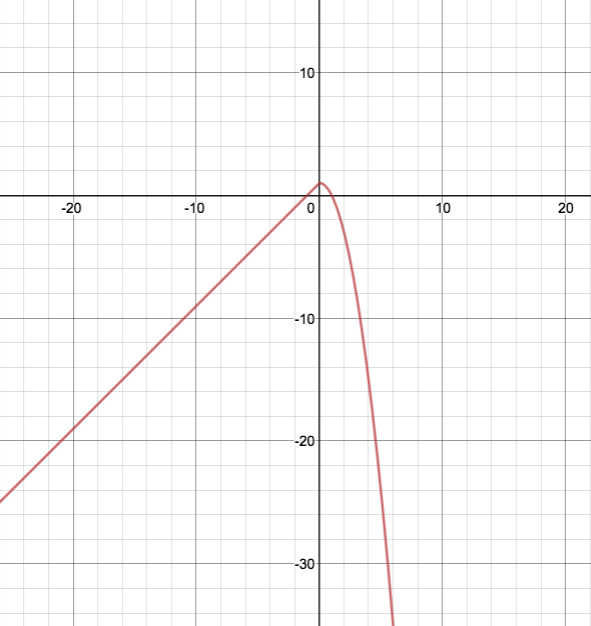
|dw:1568865698169:dw|
Ballery1:
so my calculator is saying *1.999^-03* how do i say that in numbers?
 JSVSL7:
I did it on desmos tho
Ballery1:
thanks bro i knew i could count on you <3
Ballery1:
wait wait wait wait
JSVSL7:
?
Ballery1:
the restriction on the second function -x^2 +1 is that x has to be bigger than zero. so at 0.99999 or 0.999999, i'm getting y values closer to 0
Ballery1:
at x = 1 the function is 0
Ballery1:
so f(1) = 0 aka (1,0) why's does ur graph connects with the first functions at (0,1)
JSVSL7:
? (1,0) is also a point
Ballery1:
wait give me 1 second and i'll post the picture of table of values..it'll all makes sense in a second
 JSVSL7:
Why aren't you connecting the x=1 and x=0?
 NAGC:
NAGC:
Ballery what grade you in so I can help
Ballery1:
because when i plugin f(1) the y value is 0......all micro values from 0 all the way to 1 as the restriction says...x>0....all values from 0.111111 all the way to 0.99999999999 and 1 leads closer and closer to 0
Ballery1:
see the table of values in the right corner.
Ballery1:
tell me if i'm wrong
NAGC:
what grade are you in?
Ballery1:
cooleg
NAGC:
oh nvm im only in 7th
JSVSL7:
I think you got confused. I don't really get what you're saying. It doesn't matter what y equals, it's a restriction on the domain. Also, the function is still continuous for all real numbers. If you plug in x=0.5 there is a definite value.
JSVSL7:
remember, 0 does not mean undefined.
Ballery1:
omg... i went too hammer on micro numbers to realize the other whole numbers... i see what u mean yeah i see it. at first i did connect the graph to 1 but then satan whispered in my ear...hey *what about those small values* O_O sorrry and thanks.
JSVSL7:
np
Ballery1:
thanks jsvsl
Join our real-time social learning platform and learn together with your friends!
 Bounty:
the world keeps moving fast and I'm stuck in a time lapse all I need is a minute
Bounty:
can I get so tips on how to start my journey into semi-realism art also on how to
Bounty:
the world keeps moving fast and I'm stuck in a time lapse all I need is a minute
Bounty:
can I get so tips on how to start my journey into semi-realism art also on how to
 Strawberryluna:
Read my poem. Im not for criticism its a poem I wrote after my breakup: Youu2019ll never understand the way you made me break, I hate that I still love you
Bounty:
first poem in a min- (tittle)? one moment i'm fine I smile till my face burns I laugh till I cant breath Then I cry I wonder where I went wrong I listen to
Strawberryluna:
Read my poem. Im not for criticism its a poem I wrote after my breakup: Youu2019ll never understand the way you made me break, I hate that I still love you
Bounty:
first poem in a min- (tittle)? one moment i'm fine I smile till my face burns I laugh till I cant breath Then I cry I wonder where I went wrong I listen to
 Twaylor:
3d printing a glider (for 150 pound 5'8 person - prolly should make it for up to
Twaylor:
3d printing a glider (for 150 pound 5'8 person - prolly should make it for up to
 cullenn:
pitter patter sound of rain gently tapping my window tonight. calming, soothing, right? not for me.
cullenn:
pitter patter sound of rain gently tapping my window tonight. calming, soothing, right? not for me.

 Arriyanalol:
DON'T BUY TICKETS TO SEAWORLD i watched a documentary on seaworld and its sad wha
Arriyanalol:
DON'T BUY TICKETS TO SEAWORLD i watched a documentary on seaworld and its sad wha
 natalieee:
who else wants a job in biology? I love biomedical science and want to work with
natalieee:
who else wants a job in biology? I love biomedical science and want to work with