 gababb09:
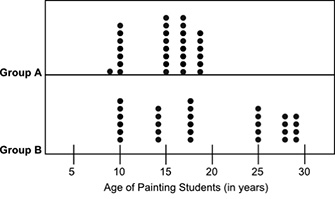
The dot plots below show the ages of students belonging to two groups of painting classes: Based on visual inspection, which group most likely has a lower mean age of painting students? Explain your answer using two or three sentences. Make sure to use facts to support your answer.
 werewolf:
add up all of the dots, then divide by the number of dots
 justjm:
No need to waste your time and find the mean of each graph. Mean has absolutely no statistical resistance as compared to the median. What this means is that skewed data is easily impacted by means, while clustered data is less impacted by means. Group B's graph is skewed to the right. There is a cluster around 10-20 but the graph is approximately multimodal and has another cluster from 25-30. This will pull the mean towards 25-30. Group A graph is slightly skewed to the left but is not as extreme and as compared to group B, it can be seen as a central cluster. This means that the mean of Group A's data is not as great as the mean of group B. Hope that helps.
justjm:
A helpful tip: Mean has no statistical resistance. Median has strong statistical resistance. Median is better to use with skewed graphs. Mean is better to use with bell curve graphs. Standard deviation and range have minimal statistical resistance. IQR has the greatest statistical resistance. Their uses are respective to that of Mean and median.
Join our real-time social learning platform and learn together with your friends!
 Bounty:
the world keeps moving fast and I'm stuck in a time lapse all I need is a minute
Bounty:
can I get so tips on how to start my journey into semi-realism art also on how to
Bounty:
the world keeps moving fast and I'm stuck in a time lapse all I need is a minute
Bounty:
can I get so tips on how to start my journey into semi-realism art also on how to
 Strawberryluna:
Read my poem. Im not for criticism its a poem I wrote after my breakup: Youu2019ll never understand the way you made me break, I hate that I still love you
Bounty:
first poem in a min- (tittle)? one moment i'm fine I smile till my face burns I laugh till I cant breath Then I cry I wonder where I went wrong I listen to
Strawberryluna:
Read my poem. Im not for criticism its a poem I wrote after my breakup: Youu2019ll never understand the way you made me break, I hate that I still love you
Bounty:
first poem in a min- (tittle)? one moment i'm fine I smile till my face burns I laugh till I cant breath Then I cry I wonder where I went wrong I listen to
 Twaylor:
3d printing a glider (for 150 pound 5'8 person - prolly should make it for up to
Twaylor:
3d printing a glider (for 150 pound 5'8 person - prolly should make it for up to
 cullenn:
pitter patter sound of rain gently tapping my window tonight. calming, soothing, right? not for me.
cullenn:
pitter patter sound of rain gently tapping my window tonight. calming, soothing, right? not for me.

 Arriyanalol:
DON'T BUY TICKETS TO SEAWORLD i watched a documentary on seaworld and its sad wha
Arriyanalol:
DON'T BUY TICKETS TO SEAWORLD i watched a documentary on seaworld and its sad wha
 natalieee:
who else wants a job in biology? I love biomedical science and want to work with
natalieee:
who else wants a job in biology? I love biomedical science and want to work with