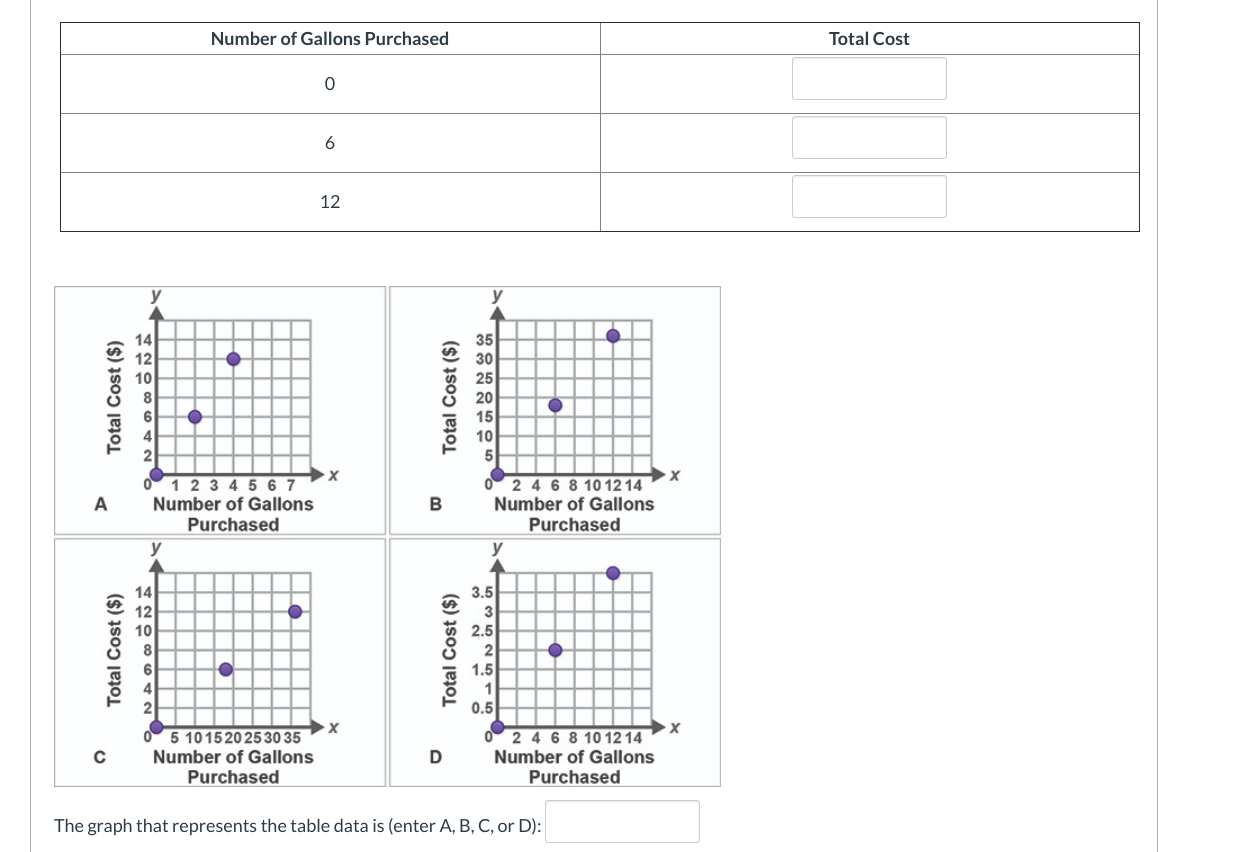
Gasoline costs $3.00 per gallon at a gas station. In the table below, enter the cost for each number of gallons purchased. Then, identify the graph that corresponds to the data in your table.
I'm not sure how I'm supposed to work these out
 Razor:
Is that all of the Graphs?
yes
Razor:
Alright, 1st one is easy to answer. 0 gallons were purchased, that'll start your answer off with 0. For 2 gallons purchased, you get $6. 2x3=6 For 4 gallons you get $12. Find a graph with this information
oh okay, thank you. Graph A matches this
Razor:
Yw ^^ I suck at math but at least I'm good with graphs
@Razor wait i have one question. Since the number of gallons purchased is 0,6,12 should I put. 0,2,4 in the total coast slot. And then the graph would be D?
Razor:
oop... Yes, put 0,2,4 in the Total cost section. No, the graph doesn't go to D, it's still A. Including x-axis and y-axis
okay
Join our real-time social learning platform and learn together with your friends!
 Bounty:
the world keeps moving fast and I'm stuck in a time lapse all I need is a minute
Bounty:
can I get so tips on how to start my journey into semi-realism art also on how to
Bounty:
the world keeps moving fast and I'm stuck in a time lapse all I need is a minute
Bounty:
can I get so tips on how to start my journey into semi-realism art also on how to
 Strawberryluna:
Read my poem. Im not for criticism its a poem I wrote after my breakup: Youu2019ll never understand the way you made me break, I hate that I still love you
Bounty:
first poem in a min- (tittle)? one moment i'm fine I smile till my face burns I laugh till I cant breath Then I cry I wonder where I went wrong I listen to
Strawberryluna:
Read my poem. Im not for criticism its a poem I wrote after my breakup: Youu2019ll never understand the way you made me break, I hate that I still love you
Bounty:
first poem in a min- (tittle)? one moment i'm fine I smile till my face burns I laugh till I cant breath Then I cry I wonder where I went wrong I listen to
 Twaylor:
3d printing a glider (for 150 pound 5'8 person - prolly should make it for up to
Twaylor:
3d printing a glider (for 150 pound 5'8 person - prolly should make it for up to
 cullenn:
pitter patter sound of rain gently tapping my window tonight. calming, soothing, right? not for me.
cullenn:
pitter patter sound of rain gently tapping my window tonight. calming, soothing, right? not for me.

 Arriyanalol:
DON'T BUY TICKETS TO SEAWORLD i watched a documentary on seaworld and its sad wha
Arriyanalol:
DON'T BUY TICKETS TO SEAWORLD i watched a documentary on seaworld and its sad wha
 natalieee:
who else wants a job in biology? I love biomedical science and want to work with
natalieee:
who else wants a job in biology? I love biomedical science and want to work with