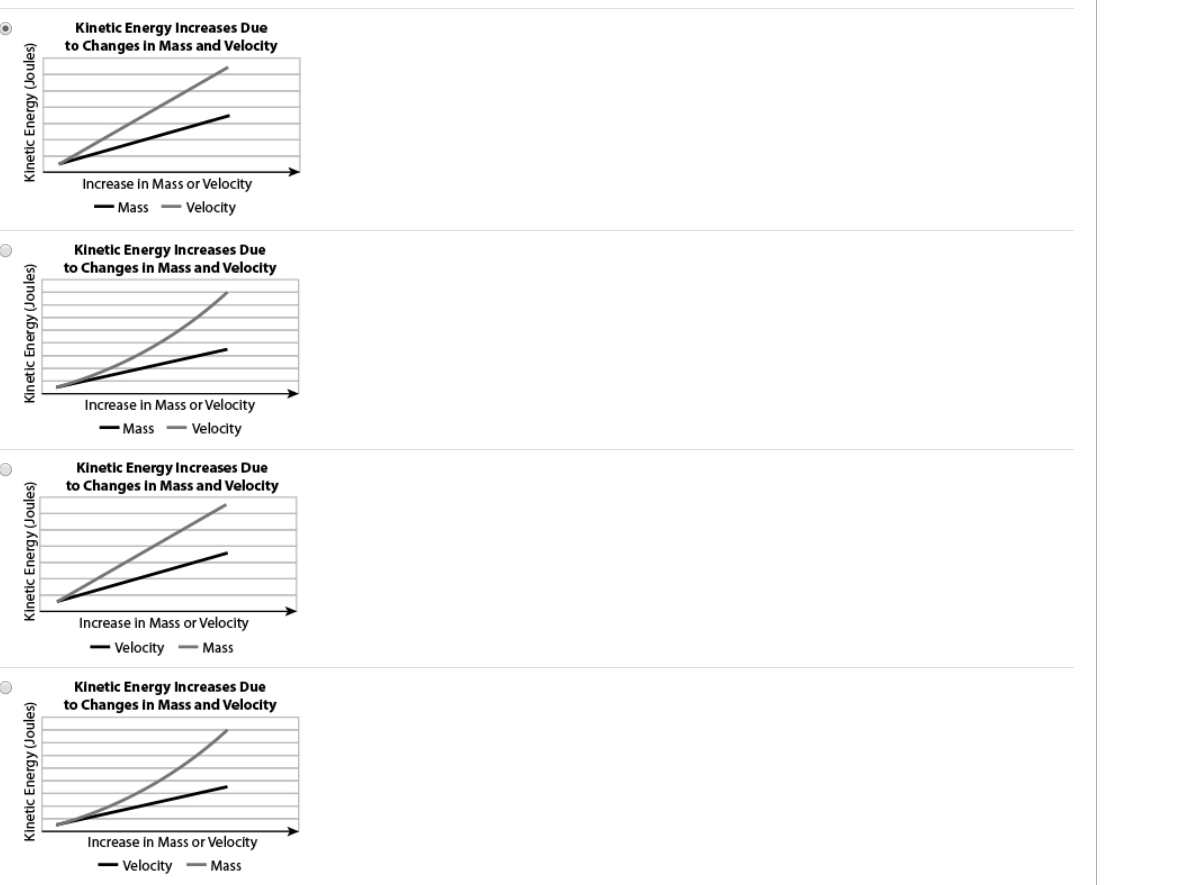
A student is conducting an investigation to determine how mass and speed affect the kinetic energy of an object. She records the data shown below. When a toy car weighing 250 grams is traveling at a speed of 2 m/s, its kinetic energy is 0.5 Joules. When the velocity of the toy car is doubled, its kinetic energy is 2 Joules. When a 250 gram weight is attached to the top of the toy car, its kinetic energy is 1 Joule when it is traveling at a speed of 2 m/s. The student wants to use the data she collected to create a graph showing how kinetic energy changes as mass and speed changes. Which of the following graphs BEST represents this relationship?
@justjm
 justjm:
You don't really need the description, just know that K=mv^2 / 2 Thus m and K are directly proportional (linear) And v and K are directly proportional but quadratic. You can match that with the graphs.
okay
so A because as the velocity increases the kinetic energy increases?
justjm:
True but not quite...it does not show a quadratic relationship between velocity and K
so if not a. I'm going to go with c
justjm:
C is incorrect.
justjm:
Do you know the magnitude of parabolic and linear functions and their look?
what does that mean?
justjm:
Remember the formula for K is mv^2 /2 . Velocity has a quadratic relationship with K, and mass has a linear relationship with K. Which graph depicts that?
Join our real-time social learning platform and learn together with your friends!
 Bounty:
the world keeps moving fast and I'm stuck in a time lapse all I need is a minute
Bounty:
can I get so tips on how to start my journey into semi-realism art also on how to
Bounty:
the world keeps moving fast and I'm stuck in a time lapse all I need is a minute
Bounty:
can I get so tips on how to start my journey into semi-realism art also on how to
 Strawberryluna:
Read my poem. Im not for criticism its a poem I wrote after my breakup: Youu2019ll never understand the way you made me break, I hate that I still love you
Bounty:
first poem in a min- (tittle)? one moment i'm fine I smile till my face burns I laugh till I cant breath Then I cry I wonder where I went wrong I listen to
Strawberryluna:
Read my poem. Im not for criticism its a poem I wrote after my breakup: Youu2019ll never understand the way you made me break, I hate that I still love you
Bounty:
first poem in a min- (tittle)? one moment i'm fine I smile till my face burns I laugh till I cant breath Then I cry I wonder where I went wrong I listen to
 Twaylor:
3d printing a glider (for 150 pound 5'8 person - prolly should make it for up to
Twaylor:
3d printing a glider (for 150 pound 5'8 person - prolly should make it for up to
 cullenn:
pitter patter sound of rain gently tapping my window tonight. calming, soothing, right? not for me.
cullenn:
pitter patter sound of rain gently tapping my window tonight. calming, soothing, right? not for me.

 Arriyanalol:
DON'T BUY TICKETS TO SEAWORLD i watched a documentary on seaworld and its sad wha
Arriyanalol:
DON'T BUY TICKETS TO SEAWORLD i watched a documentary on seaworld and its sad wha
 natalieee:
who else wants a job in biology? I love biomedical science and want to work with
natalieee:
who else wants a job in biology? I love biomedical science and want to work with