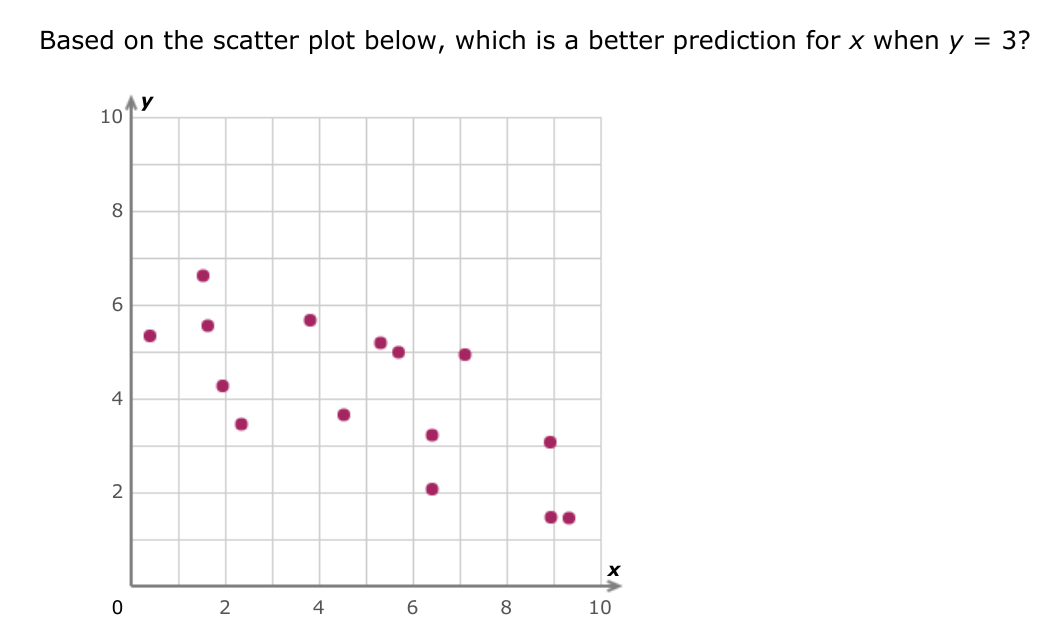
Based on the scatter plot below, which is a better prediction for x when y=3? A.0 B.8
 TheSmartOne:
So look at y= 3 What are the x values given on the graph
0,2,4,6,8,10
TheSmartOne:
That's from the x-axis I'm talking about the points Which points are there where the y-value is 3
TheSmartOne:
Remember points are labeled like (x, y) Y is the vertical one and x is the horizontal one
oh, okay. It looks like there both labeled like that
TheSmartOne:
You're looking at the bottom lines and not the points |dw:1587571278738:dw| Here's an example, you see how that dot It's where x (the horizontal) = 4 and y (the vertical) = 4 So the point is labelled (x, y) which would be (4, 4) Do you understand?
yes
so by this am I supposed to look at which answer is close or y-axis is 3?
TheSmartOne:
|dw:1587571451550:dw| Similarly this is how (2, 3) would be
TheSmartOne:
So yes, so on the vertical line, go up to 3 And then slide your finger across horizontally this way ---> What points do you see
I see some points close to 8 but no (8,3) or (0,3)
TheSmartOne:
yes, so we're not trying to find an exact point but rather where another point could be in the graph So you can see the points follow a pattern
TheSmartOne:
|dw:1587571877745:dw|
TheSmartOne:
|dw:1587571902390:dw| See how as the x-value increases, the y-value on average is decreasing
TheSmartOne:
So the question you have is asking Which of the two points belongs on this graph. Which one fits in? Is it (0, 3) or (0, 8)
TheSmartOne:
(0, 3) or (8, 3) *****
(8,3)
TheSmartOne:
And that's right!! (0, 8) would also be right if the question was more in general and not asking about y=3 But good job!!
Thank you so much!
TheSmartOne:
It was my pleasure!
Join our real-time social learning platform and learn together with your friends!
 Bounty:
the world keeps moving fast and I'm stuck in a time lapse all I need is a minute
Bounty:
can I get so tips on how to start my journey into semi-realism art also on how to
Bounty:
the world keeps moving fast and I'm stuck in a time lapse all I need is a minute
Bounty:
can I get so tips on how to start my journey into semi-realism art also on how to
 Strawberryluna:
Read my poem. Im not for criticism its a poem I wrote after my breakup: Youu2019ll never understand the way you made me break, I hate that I still love you
Bounty:
first poem in a min- (tittle)? one moment i'm fine I smile till my face burns I laugh till I cant breath Then I cry I wonder where I went wrong I listen to
Strawberryluna:
Read my poem. Im not for criticism its a poem I wrote after my breakup: Youu2019ll never understand the way you made me break, I hate that I still love you
Bounty:
first poem in a min- (tittle)? one moment i'm fine I smile till my face burns I laugh till I cant breath Then I cry I wonder where I went wrong I listen to
 Twaylor:
3d printing a glider (for 150 pound 5'8 person - prolly should make it for up to
Twaylor:
3d printing a glider (for 150 pound 5'8 person - prolly should make it for up to
 cullenn:
pitter patter sound of rain gently tapping my window tonight. calming, soothing, right? not for me.
cullenn:
pitter patter sound of rain gently tapping my window tonight. calming, soothing, right? not for me.

 Arriyanalol:
DON'T BUY TICKETS TO SEAWORLD i watched a documentary on seaworld and its sad wha
Arriyanalol:
DON'T BUY TICKETS TO SEAWORLD i watched a documentary on seaworld and its sad wha
 natalieee:
who else wants a job in biology? I love biomedical science and want to work with
natalieee:
who else wants a job in biology? I love biomedical science and want to work with