 mikewwe13:
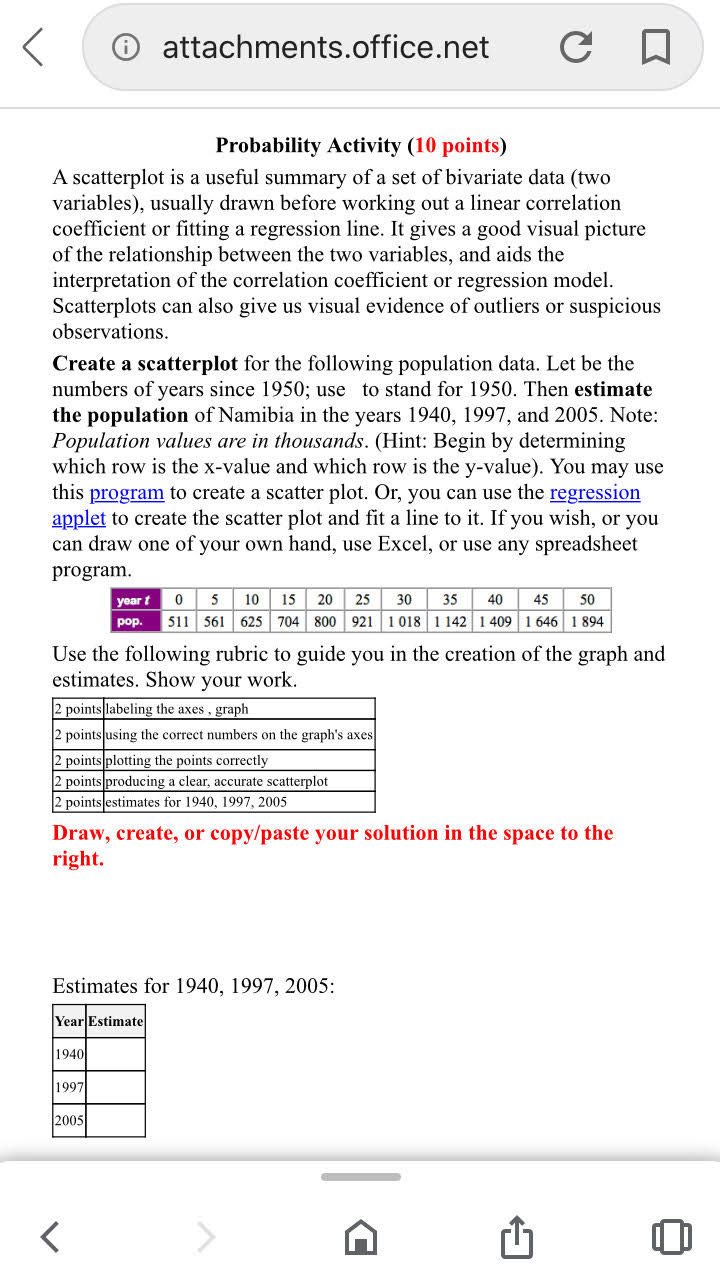
Scatter Plot
 mickey20:
@Eiwoh2
mickey20:
@Vocaloid
 Eiwoh2:
@dude @imqwerty
 Charlie:
@dude @imqwerty @Vocaloid
Charlie:
@Ultrilliam
 darkknight:
Ha, no one thought of tagging me. All good thou
darkknight:
So what we have to do is to make a scatterplot basically, I don't want to do the whole thing by myself but I will guide you through this. So it says that the population values are in the thousands. And the Years start from 1950. We also know that this is linear. You want years to be x and population to be y. Note that the population values are in the thousands too. So you would probably label the x-axis something like number of years after 1950. And the y-axis something like population number in thousands. After you have finished the first 2 steps. You want to plot the points correctly and I am pretty sure that there is a line of best fit tool. And that is what you want to use. So once everything is clear and accurate, you just have to estimate the population at a given time. So your line of best fit will be what you use to estimate the population at any given time t, where t(0) = 1950. So whatever equation you get, you want to plug the numbers in according to that. So for example if y=10x+511 is the equation for your line of best fit. Then to find the population for 1940 you have to plug in -10 for x not 1940 because 0 is 1950 and 1940 is 10 years less than that. You can also do it another way too.
Join our real-time social learning platform and learn together with your friends!
 Bounty:
the world keeps moving fast and I'm stuck in a time lapse all I need is a minute
Bounty:
can I get so tips on how to start my journey into semi-realism art also on how to
Bounty:
the world keeps moving fast and I'm stuck in a time lapse all I need is a minute
Bounty:
can I get so tips on how to start my journey into semi-realism art also on how to
 Strawberryluna:
Read my poem. Im not for criticism its a poem I wrote after my breakup: Youu2019ll never understand the way you made me break, I hate that I still love you
Bounty:
first poem in a min- (tittle)? one moment i'm fine I smile till my face burns I laugh till I cant breath Then I cry I wonder where I went wrong I listen to
Strawberryluna:
Read my poem. Im not for criticism its a poem I wrote after my breakup: Youu2019ll never understand the way you made me break, I hate that I still love you
Bounty:
first poem in a min- (tittle)? one moment i'm fine I smile till my face burns I laugh till I cant breath Then I cry I wonder where I went wrong I listen to
 Twaylor:
3d printing a glider (for 150 pound 5'8 person - prolly should make it for up to
Twaylor:
3d printing a glider (for 150 pound 5'8 person - prolly should make it for up to
 cullenn:
pitter patter sound of rain gently tapping my window tonight. calming, soothing, right? not for me.
cullenn:
pitter patter sound of rain gently tapping my window tonight. calming, soothing, right? not for me.

 Arriyanalol:
DON'T BUY TICKETS TO SEAWORLD i watched a documentary on seaworld and its sad wha
Arriyanalol:
DON'T BUY TICKETS TO SEAWORLD i watched a documentary on seaworld and its sad wha
 natalieee:
who else wants a job in biology? I love biomedical science and want to work with
natalieee:
who else wants a job in biology? I love biomedical science and want to work with