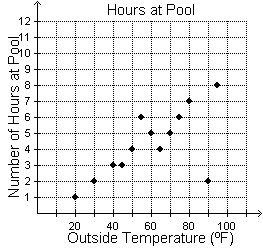
The scatterplot shows the number of weekly hours that swimmers spend at an indoor pool and the average weekly outdoor temperature. A graph titled Hours at Pool has Outside Temperature (degrees Fahrenheit) on the x-axis and Number of Hours at Pool on the y-axis. Point (90, 2) is outside of the cluster. Which data value would cause the interpretation of the data set to be understated? (20, 1) (55, 6) (90, 2) (95, 8)
Help me please
 darkknight:
Do you know what it means by Which data value would cause the interpretation of the data set to be understated?
No
darkknight:
Understated mean that describe or represent (something) as being smaller, worse, or less important than it actually is.
darkknight:
So look at all the points. Which point is like way outside the cluster? Hint the problem also tells you.
ok
darkknight:
Which point do you think will undervalue the data?
Point1 and 2
 Nonportirt:
I'll help The answer is option C "90,2." Understated means to express something in a effective way in this question it's asking which sets of numbers would cause the graph to be understated and it would be 90,2 because its the lowest set of numbers.
Ok thx
darkknight:
Yes basically what Nonportrait said. option C is outside the cluster and basically doesn't follow the trend of the other ones.
Join our real-time social learning platform and learn together with your friends!
 Bounty:
the world keeps moving fast and I'm stuck in a time lapse all I need is a minute
Bounty:
can I get so tips on how to start my journey into semi-realism art also on how to
Bounty:
the world keeps moving fast and I'm stuck in a time lapse all I need is a minute
Bounty:
can I get so tips on how to start my journey into semi-realism art also on how to
 Strawberryluna:
Read my poem. Im not for criticism its a poem I wrote after my breakup: Youu2019ll never understand the way you made me break, I hate that I still love you
Bounty:
first poem in a min- (tittle)? one moment i'm fine I smile till my face burns I laugh till I cant breath Then I cry I wonder where I went wrong I listen to
Strawberryluna:
Read my poem. Im not for criticism its a poem I wrote after my breakup: Youu2019ll never understand the way you made me break, I hate that I still love you
Bounty:
first poem in a min- (tittle)? one moment i'm fine I smile till my face burns I laugh till I cant breath Then I cry I wonder where I went wrong I listen to
 Twaylor:
3d printing a glider (for 150 pound 5'8 person - prolly should make it for up to
Twaylor:
3d printing a glider (for 150 pound 5'8 person - prolly should make it for up to
 cullenn:
pitter patter sound of rain gently tapping my window tonight. calming, soothing, right? not for me.
cullenn:
pitter patter sound of rain gently tapping my window tonight. calming, soothing, right? not for me.

 Arriyanalol:
DON'T BUY TICKETS TO SEAWORLD i watched a documentary on seaworld and its sad wha
Arriyanalol:
DON'T BUY TICKETS TO SEAWORLD i watched a documentary on seaworld and its sad wha
 natalieee:
who else wants a job in biology? I love biomedical science and want to work with
natalieee:
who else wants a job in biology? I love biomedical science and want to work with