 Someone1:
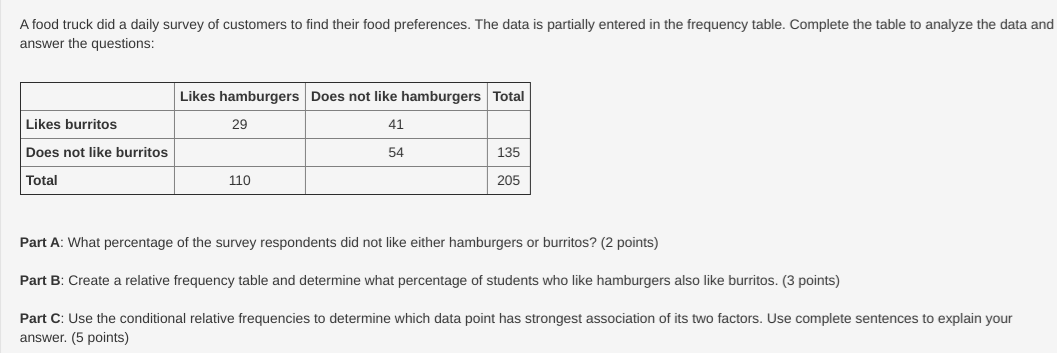
A food truck did a daily survey of customers to find their food preferences. The data is partially entered in the frequency table. Complete the table to analyze the data and answer the questions Part A: What percentage of the survey respondents did not like either hamburgers or burritos? (2 points) Part B: Create a relative frequency table and determine what percentage of students who like hamburgers also like burritos. (3 points) Part C: Use the conditional relative frequencies to determine which data point has strongest association of its two factors. Use complete sentences to explain your answer. (5 points)
 jhonyy9:
please post details missed
 jhonyy9:
hi this is very very easy how you get total in the first line ? what you need to do ?
Someone1:
well u add them up so 29+41= 70
jhonyy9:
exactly
Someone1:
thanks
jhonyy9:
continue please in the second line how many you need adding to 54 for get 135 ?
jhonyy9:
or you see this like hamburgers column
Someone1:
that would be 81 and then for the bottom it would be 95
jhonyy9:
this you can solve it in two ways
jhonyy9:
perfect do you understand now the way ?
Someone1:
yea i think i got em now thx
jhonyy9:
np was my pleasure have a nice day bye bye and any time
Someone1:
thx u do the same
jhonyy9:
ty
Join our real-time social learning platform and learn together with your friends!
 Bounty:
the world keeps moving fast and I'm stuck in a time lapse all I need is a minute
Bounty:
can I get so tips on how to start my journey into semi-realism art also on how to
Bounty:
the world keeps moving fast and I'm stuck in a time lapse all I need is a minute
Bounty:
can I get so tips on how to start my journey into semi-realism art also on how to
 Strawberryluna:
Read my poem. Im not for criticism its a poem I wrote after my breakup: Youu2019ll never understand the way you made me break, I hate that I still love you
Bounty:
first poem in a min- (tittle)? one moment i'm fine I smile till my face burns I laugh till I cant breath Then I cry I wonder where I went wrong I listen to
Strawberryluna:
Read my poem. Im not for criticism its a poem I wrote after my breakup: Youu2019ll never understand the way you made me break, I hate that I still love you
Bounty:
first poem in a min- (tittle)? one moment i'm fine I smile till my face burns I laugh till I cant breath Then I cry I wonder where I went wrong I listen to
 Twaylor:
3d printing a glider (for 150 pound 5'8 person - prolly should make it for up to
Twaylor:
3d printing a glider (for 150 pound 5'8 person - prolly should make it for up to
 cullenn:
pitter patter sound of rain gently tapping my window tonight. calming, soothing, right? not for me.
cullenn:
pitter patter sound of rain gently tapping my window tonight. calming, soothing, right? not for me.

 Arriyanalol:
DON'T BUY TICKETS TO SEAWORLD i watched a documentary on seaworld and its sad wha
Arriyanalol:
DON'T BUY TICKETS TO SEAWORLD i watched a documentary on seaworld and its sad wha
 natalieee:
who else wants a job in biology? I love biomedical science and want to work with
natalieee:
who else wants a job in biology? I love biomedical science and want to work with