Ask
your own question, for FREE!
Mathematics
6 Online
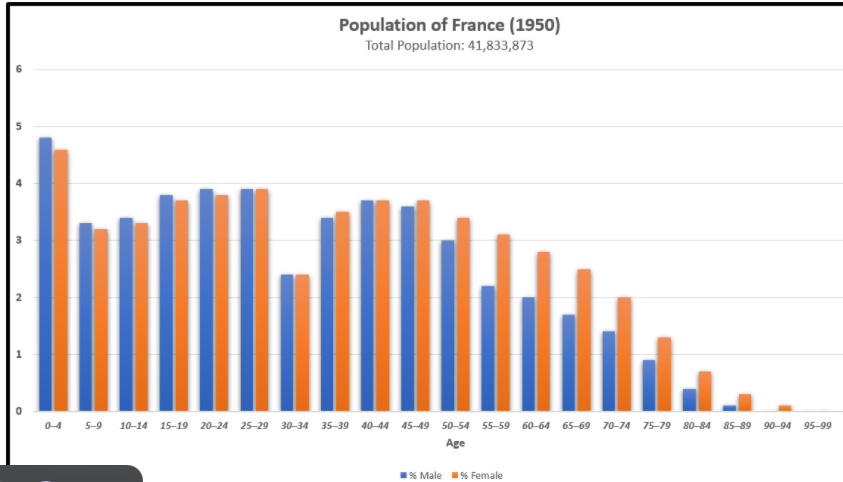
View this population chart of France in 1950. Take notes about the trends in the chart, where dips in population might occur, and the numbers of men and women in different age groups. Part A Using this timeline of France, hypothesize why the population chart shows a dip in the 30 to 34 year-old age group for men and women in 1950. What is one event that probably contributed to this drop?
Still Need Help?
Join the QuestionCove community and study together with friends!
Can't find your answer?
Make a FREE account and ask your own questions, OR help others and earn volunteer hours!
Join our real-time social learning platform and learn together with your friends!
Join our real-time social learning platform and learn together with your friends!
Latest Questions
 Bounty:
the world keeps moving fast and I'm stuck in a time lapse all I need is a minute
Bounty:
can I get so tips on how to start my journey into semi-realism art also on how to
Bounty:
the world keeps moving fast and I'm stuck in a time lapse all I need is a minute
Bounty:
can I get so tips on how to start my journey into semi-realism art also on how to
 Strawberryluna:
Read my poem. Im not for criticism its a poem I wrote after my breakup: Youu2019ll never understand the way you made me break, I hate that I still love you
Bounty:
first poem in a min- (tittle)? one moment i'm fine I smile till my face burns I laugh till I cant breath Then I cry I wonder where I went wrong I listen to
Strawberryluna:
Read my poem. Im not for criticism its a poem I wrote after my breakup: Youu2019ll never understand the way you made me break, I hate that I still love you
Bounty:
first poem in a min- (tittle)? one moment i'm fine I smile till my face burns I laugh till I cant breath Then I cry I wonder where I went wrong I listen to
 Twaylor:
3d printing a glider (for 150 pound 5'8 person - prolly should make it for up to
Twaylor:
3d printing a glider (for 150 pound 5'8 person - prolly should make it for up to
 cullenn:
pitter patter sound of rain gently tapping my window tonight. calming, soothing, right? not for me.
cullenn:
pitter patter sound of rain gently tapping my window tonight. calming, soothing, right? not for me.
 Arriyanalol:
DON'T BUY TICKETS TO SEAWORLD i watched a documentary on seaworld and its sad wha
Arriyanalol:
DON'T BUY TICKETS TO SEAWORLD i watched a documentary on seaworld and its sad wha
 natalieee:
who else wants a job in biology? I love biomedical science and want to work with
natalieee:
who else wants a job in biology? I love biomedical science and want to work with
Bounty:
the world keeps moving fast and I'm stuck in a time lapse all I need is a minute
2 days ago
1 Reply
0 Medals
Bounty:
can I get so tips on how to start my journey into semi-realism art also on how to
1 week ago
0 Replies
0 Medals
Strawberryluna:
Read my poem. Im not for criticism its a poem I wrote after my breakup: Youu2019ll never understand the way you made me break, I hate that I still love you
1 week ago
4 Replies
2 Medals
Bounty:
first poem in a min- (tittle)? one moment i'm fine I smile till my face burns I laugh till I cant breath Then I cry I wonder where I went wrong I listen to
1 week ago
5 Replies
1 Medal
Twaylor:
3d printing a glider (for 150 pound 5'8 person - prolly should make it for up to
1 week ago
5 Replies
0 Medals
cullenn:
pitter patter sound of rain gently tapping my window tonight. calming, soothing, right? not for me.
1 week ago
2 Replies
0 Medals
 Arriyanalol:
DON'T BUY TICKETS TO SEAWORLD i watched a documentary on seaworld and its sad wha
Arriyanalol:
DON'T BUY TICKETS TO SEAWORLD i watched a documentary on seaworld and its sad wha
3 weeks ago
2 Replies
1 Medal
natalieee:
who else wants a job in biology? I love biomedical science and want to work with
3 weeks ago
9 Replies
0 Medals