Ask
your own question, for FREE!
Miscellaneous
4 Online
 Gucchi:
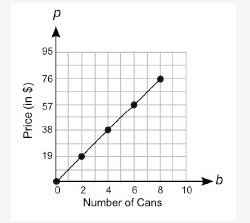
The graph below shows the price of different numbers of cans of beans at a store: A graph is shown. The values on the x axis are 0, 2, 4, 6, 8, 10. The values on the y axis are 0, 19, 38, 57, 76, and 95. Points are shown on ordered pairs 0, 0 and 2, 19 and 4, 38 and 6, 57 and 8, 76. These points are connected by a line. The label on the x axis is Number of Cans. The title on the y axis is Price in dollars. Which equation can be used to determine p, the cost of b cans of beans? p = 9.50 + b p = 9.50b b = 9.50 + p b = 9.50p
Still Need Help?
Join the QuestionCove community and study together with friends!
Gucchi:
Please answer this!
 JNJACK02:
ok
Gucchi:
What do you think the answer is?
Gucchi:
You figure it out?
JNJACK02:
not yet
Still Need Help?
Join the QuestionCove community and study together with friends!
 jhonyy9:
please post the graph ...

 JNJACK02:
are yall still trying to figure this out?
Can't find your answer?
Make a FREE account and ask your own questions, OR help others and earn volunteer hours!
Join our real-time social learning platform and learn together with your friends!
Join our real-time social learning platform and learn together with your friends!
Latest Questions
 Bounty:
the world keeps moving fast and I'm stuck in a time lapse all I need is a minute
Bounty:
can I get so tips on how to start my journey into semi-realism art also on how to
Bounty:
the world keeps moving fast and I'm stuck in a time lapse all I need is a minute
Bounty:
can I get so tips on how to start my journey into semi-realism art also on how to
 Strawberryluna:
Read my poem. Im not for criticism its a poem I wrote after my breakup: Youu2019ll never understand the way you made me break, I hate that I still love you
Bounty:
first poem in a min- (tittle)? one moment i'm fine I smile till my face burns I laugh till I cant breath Then I cry I wonder where I went wrong I listen to
Strawberryluna:
Read my poem. Im not for criticism its a poem I wrote after my breakup: Youu2019ll never understand the way you made me break, I hate that I still love you
Bounty:
first poem in a min- (tittle)? one moment i'm fine I smile till my face burns I laugh till I cant breath Then I cry I wonder where I went wrong I listen to
 Twaylor:
3d printing a glider (for 150 pound 5'8 person - prolly should make it for up to
Twaylor:
3d printing a glider (for 150 pound 5'8 person - prolly should make it for up to
 cullenn:
pitter patter sound of rain gently tapping my window tonight. calming, soothing, right? not for me.
cullenn:
pitter patter sound of rain gently tapping my window tonight. calming, soothing, right? not for me.
 Arriyanalol:
DON'T BUY TICKETS TO SEAWORLD i watched a documentary on seaworld and its sad wha
Arriyanalol:
DON'T BUY TICKETS TO SEAWORLD i watched a documentary on seaworld and its sad wha
 natalieee:
who else wants a job in biology? I love biomedical science and want to work with
natalieee:
who else wants a job in biology? I love biomedical science and want to work with
Bounty:
the world keeps moving fast and I'm stuck in a time lapse all I need is a minute
2 days ago
1 Reply
0 Medals
Bounty:
can I get so tips on how to start my journey into semi-realism art also on how to
1 week ago
0 Replies
0 Medals
Strawberryluna:
Read my poem. Im not for criticism its a poem I wrote after my breakup: Youu2019ll never understand the way you made me break, I hate that I still love you
1 week ago
4 Replies
2 Medals
Bounty:
first poem in a min- (tittle)? one moment i'm fine I smile till my face burns I laugh till I cant breath Then I cry I wonder where I went wrong I listen to
1 week ago
5 Replies
1 Medal
Twaylor:
3d printing a glider (for 150 pound 5'8 person - prolly should make it for up to
1 week ago
5 Replies
0 Medals
cullenn:
pitter patter sound of rain gently tapping my window tonight. calming, soothing, right? not for me.
1 week ago
2 Replies
0 Medals
 Arriyanalol:
DON'T BUY TICKETS TO SEAWORLD i watched a documentary on seaworld and its sad wha
Arriyanalol:
DON'T BUY TICKETS TO SEAWORLD i watched a documentary on seaworld and its sad wha
3 weeks ago
2 Replies
1 Medal
natalieee:
who else wants a job in biology? I love biomedical science and want to work with
3 weeks ago
9 Replies
0 Medals