 olivia14:
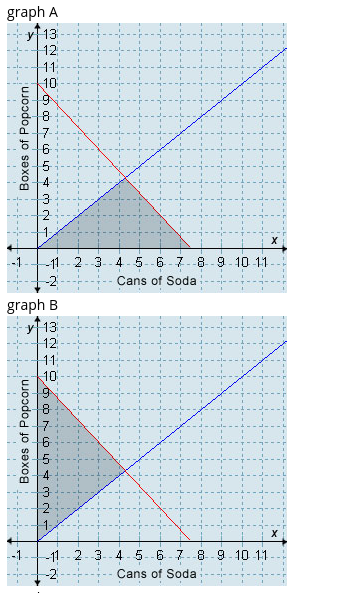
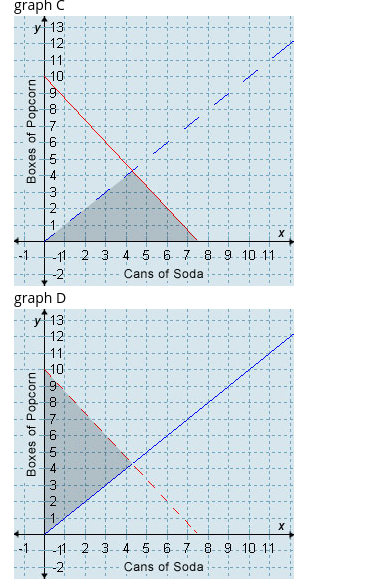
You attend a baseball game with friends and visit the snack stand between innings. Soda costs $2 a can, and a box of popcorn costs $1.50. You have $15 with you, and you wish to buy more cans of soda than boxes of popcorn. If x represents the number of cans of soda and y the number of boxes of popcorn, which graph represents the inequalities in this scenario? A. graph A B. graph B C. graph C D. graph D
 Brazyxkapalot:
I feel like imma b wrong
olivia14:
i just really need to know how to write the equation
 MrMudd183:
I'm currently trying to look at the info given and work the problem out
olivia14:
okay thanks mudd
MrMudd183:
I think it's D. You can get 6 sodas for $12 and 2 boxes of popcorn for $3. 2+2+2+2+2+2+1.5+1.5 4+4+4+3 8+7 15
olivia14:
ok ok makes sense
olivia14:
ahh it was wrong but thanks anyways
MrMudd183:
I'm sorry, I had the right thinking but I must've chose the wrong graph
olivia14:
no its no problem lol i appreciate u helping me anyways
Join our real-time social learning platform and learn together with your friends!
 Bounty:
the world keeps moving fast and I'm stuck in a time lapse all I need is a minute
Bounty:
can I get so tips on how to start my journey into semi-realism art also on how to
Bounty:
the world keeps moving fast and I'm stuck in a time lapse all I need is a minute
Bounty:
can I get so tips on how to start my journey into semi-realism art also on how to
 Strawberryluna:
Read my poem. Im not for criticism its a poem I wrote after my breakup: Youu2019ll never understand the way you made me break, I hate that I still love you
Bounty:
first poem in a min- (tittle)? one moment i'm fine I smile till my face burns I laugh till I cant breath Then I cry I wonder where I went wrong I listen to
Strawberryluna:
Read my poem. Im not for criticism its a poem I wrote after my breakup: Youu2019ll never understand the way you made me break, I hate that I still love you
Bounty:
first poem in a min- (tittle)? one moment i'm fine I smile till my face burns I laugh till I cant breath Then I cry I wonder where I went wrong I listen to
 Twaylor:
3d printing a glider (for 150 pound 5'8 person - prolly should make it for up to
Twaylor:
3d printing a glider (for 150 pound 5'8 person - prolly should make it for up to
 cullenn:
pitter patter sound of rain gently tapping my window tonight. calming, soothing, right? not for me.
cullenn:
pitter patter sound of rain gently tapping my window tonight. calming, soothing, right? not for me.

 Arriyanalol:
DON'T BUY TICKETS TO SEAWORLD i watched a documentary on seaworld and its sad wha
Arriyanalol:
DON'T BUY TICKETS TO SEAWORLD i watched a documentary on seaworld and its sad wha
 natalieee:
who else wants a job in biology? I love biomedical science and want to work with
natalieee:
who else wants a job in biology? I love biomedical science and want to work with