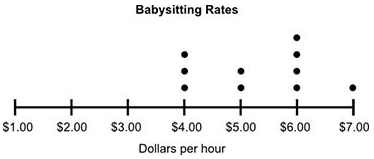
The dot plot below shows the hourly rate of some babysitters: A number line is shown from 1 dollar to 7 dollars in increments of 1 dollar for each tick mark. The horizontal axis label is Dollars per Hour. There are 3 dots above 4 dollars, 2 dots above 5 dollars, 4 dots above 6 dollars, and 1 dot above 7 dollars. The title of the line plot is Babysitting Rates. Based on the data shown, how many babysitters surveyed earned $5 or less per hour? (1 point) A. 2 B. 3 C. 5 D. 9
 ZombieLover:
simply count the # of dots above $5 and $6
5 and 6 ? what does that mean ?
ohhhh
my bad i got a little slow there
ZombieLover:
lol
ZombieLover:
its cool
they each combine to 6
because i added both of the numbers
ZombieLover:
ok guess your answer we caint give direct
...
i dont get how that was suposed to help me
you told me to count the dots above 5 and 6 and its 6 all together but theres no answer that says 6 so what do i do now ??
 Hoodmemes:
\(\color{#0cbb34}{\text{Originally Posted by}}\) @ZombieLover simply count the # of dots above $5 and $6 \(\color{#0cbb34}{\text{End of Quote}}\) This would be the incorrect way to solve this,do not copy work directly from old users.
Hoodmemes:
As we can see it says "Based on the data shown, how many babysitters surveyed earned $5 or less per hour? (1 point)" (5 dollars or less than 5 dollars) The only one lower than (5) is the (4) Count the dots on (4) and (5) 4's dots: 3 5's dots: 2 \[2+3=5\] So answer option C.)5 would have been correct.
i did a while ago i just needed to look at the question again thank you tho bro appreate it
Hoodmemes:
np
Join our real-time social learning platform and learn together with your friends!
 natalieee:
who else wants a job in biology? I love biomedical science and want to work with
natalieee:
who else wants a job in biology? I love biomedical science and want to work with
 Twaylor:
Time flies doesn't it? I tried to not be the second squeaky wheel of the household and ended up hurting myself and others severely.
Twaylor:
Time flies doesn't it? I tried to not be the second squeaky wheel of the household and ended up hurting myself and others severely.
 clllaaaaaire:
any tips? the quality isn't the best because I am using this site on my computer
clllaaaaaire:
any tips? the quality isn't the best because I am using this site on my computer
 Midnight97:
Kinda a roleplay story between me and my friend enjoy... Part one Forgive me for all the screenshots.
Midnight97:
Kinda a roleplay story between me and my friend enjoy... Part one Forgive me for all the screenshots.
 StevenisGhost:
what type of song should I make next, and will y'all go check out my new song on
Midnight97:
My drawing sure changed over the years look at these two pictures from 2024 to no
StevenisGhost:
what type of song should I make next, and will y'all go check out my new song on
Midnight97:
My drawing sure changed over the years look at these two pictures from 2024 to no
 EdwinJsHispanic:
"poem" love is So Beautiful to have. But it's so hard to have. At this point I don't know whether its worth the wait Or if it's just millions of miles to re
EdwinJsHispanic:
"poem" love is So Beautiful to have. But it's so hard to have. At this point I don't know whether its worth the wait Or if it's just millions of miles to re
EdwinJsHispanic:
"poem" love is So Beautiful to have. But it's so hard to have. At this point I don't know whether its worth the wait Or if it's just millions of miles to re
EdwinJsHispanic:
"poem" love is So Beautiful to have. But it's so hard to have. At this point I don't know whether its worth the wait Or if it's just millions of miles to re