 teressa24:
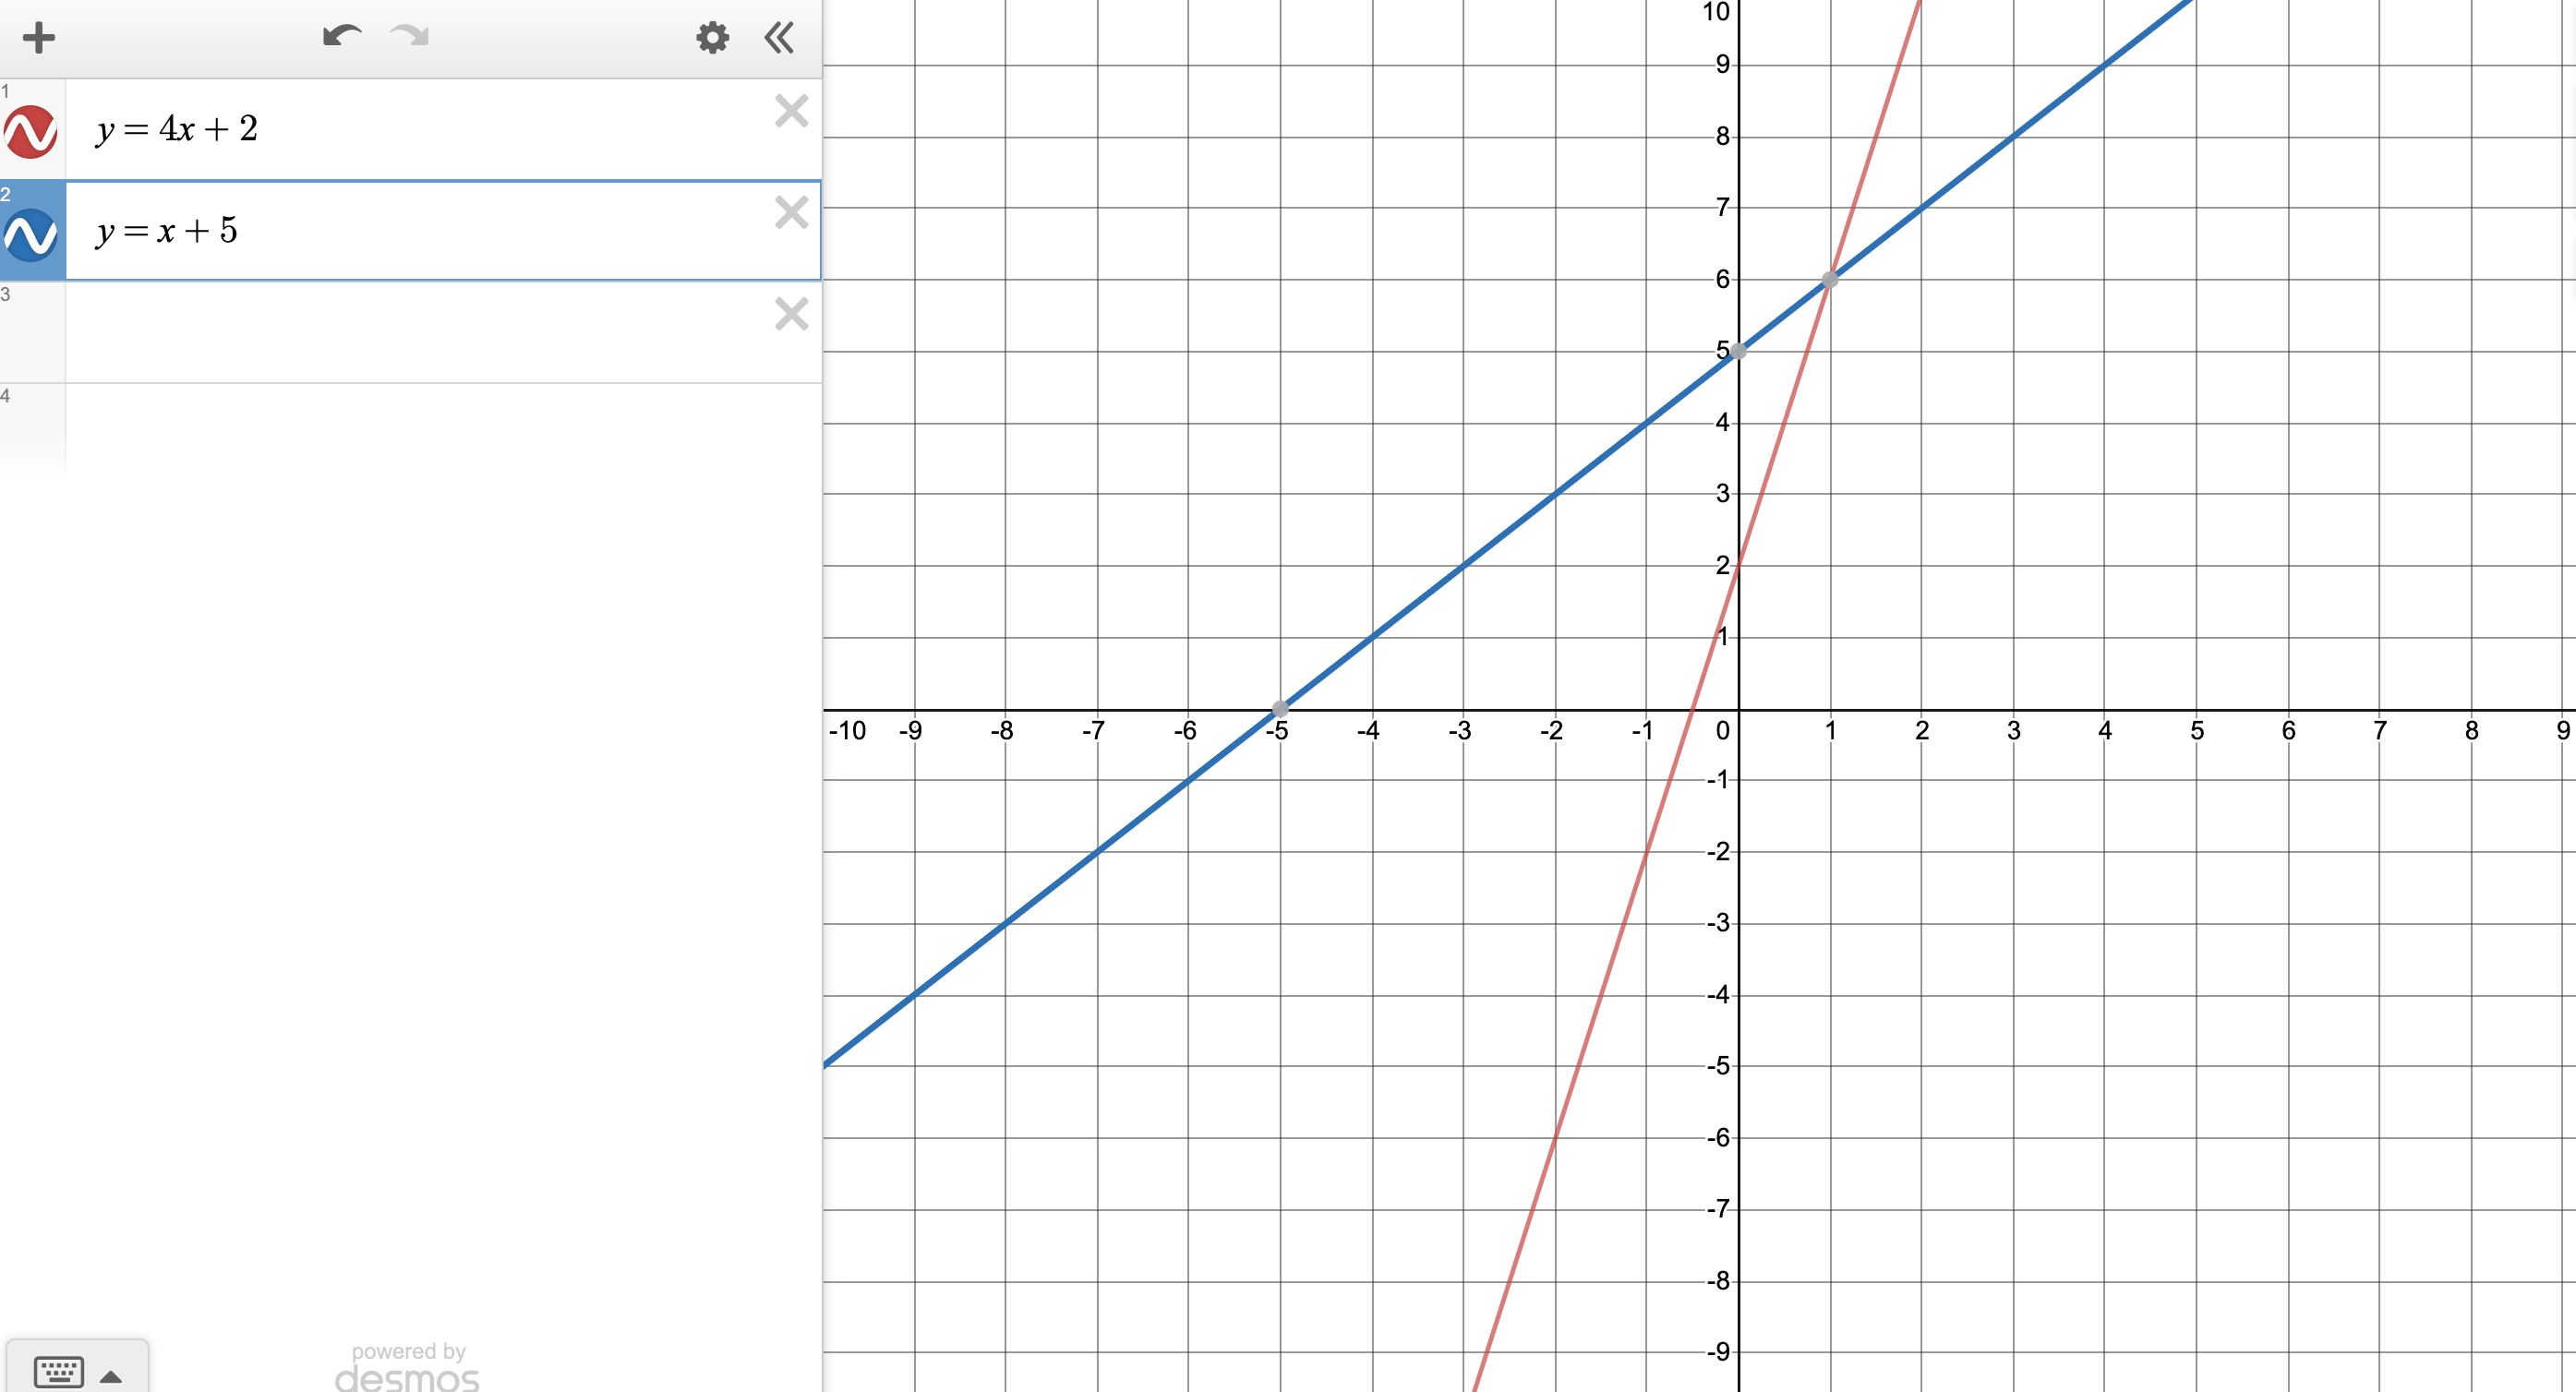
Which graph best represents the solution to the following pair of equations? (1 point) y = 4x + 2 y = x + 5 A graph is plotted with values ranging from negative 10 to 10 on both x axis and y axis at increments of 1. Two lines having equations y is equal to 4 times x plus 2 and y is equal to x plus 5 are plotted. These 2 lines intersect at the ordered pair 1, 6. A graph is plotted with values ranging from negative 10 to 10 on both x axis and y axis at increments of 1. Two lines having equations y is equal to 4 times x plus 2 and y is equal to x plus 5 are plotted. These 2 lines intersect at the ordered pair 2, negative 7. A graph is plotted with values ranging from negative 10 to 10 on both x axis and y axis at increments of 1. Two lines having equations y is equal to 4 times x plus 2 and y is equal to x plus 5 are plotted. These 2 lines intersect at the ordered pair negative 1, negative 6. A graph is plotted with values ranging from negative 10 to 10 on both x axis and y axis at increments of 1. Two lines having equations y is equal to 4 times x plus 2 and y is equal to x plus 5 are plotted. These 2 lines intersect at the ordered pair negative 2, 7.
 Angle:
Hello @teressa24 ! Welcome to QuestionCove Give me a minute to read your question :)
teressa24:
ok thank you :)
 Angle:
The image attached to the previous comment was generated by Desmos.com it is a useful graphing website :)
teressa24:
ok thank you
Angle:
the picture should help you answer your question, but if you are still stuck just let me know
teressa24:
ok i will
teressa24:
i got it
Angle:
awesome! :)
teressa24:
thank you
Angle:
if you have another question, feel free to "close" this question and post another one
teressa24:
ok
Join our real-time social learning platform and learn together with your friends!
 natalieee:
who else wants a job in biology? I love biomedical science and want to work with
natalieee:
who else wants a job in biology? I love biomedical science and want to work with
 Twaylor:
Time flies doesn't it? I tried to not be the second squeaky wheel of the household and ended up hurting myself and others severely.
Twaylor:
Time flies doesn't it? I tried to not be the second squeaky wheel of the household and ended up hurting myself and others severely.
 clllaaaaaire:
any tips? the quality isn't the best because I am using this site on my computer
clllaaaaaire:
any tips? the quality isn't the best because I am using this site on my computer
 Midnight97:
Kinda a roleplay story between me and my friend enjoy... Part one Forgive me for all the screenshots.
Midnight97:
Kinda a roleplay story between me and my friend enjoy... Part one Forgive me for all the screenshots.
 StevenisGhost:
what type of song should I make next, and will y'all go check out my new song on
Midnight97:
My drawing sure changed over the years look at these two pictures from 2024 to no
StevenisGhost:
what type of song should I make next, and will y'all go check out my new song on
Midnight97:
My drawing sure changed over the years look at these two pictures from 2024 to no
 EdwinJsHispanic:
"poem" love is So Beautiful to have. But it's so hard to have. At this point I don't know whether its worth the wait Or if it's just millions of miles to re
EdwinJsHispanic:
"poem" love is So Beautiful to have. But it's so hard to have. At this point I don't know whether its worth the wait Or if it's just millions of miles to re
EdwinJsHispanic:
"poem" love is So Beautiful to have. But it's so hard to have. At this point I don't know whether its worth the wait Or if it's just millions of miles to re
EdwinJsHispanic:
"poem" love is So Beautiful to have. But it's so hard to have. At this point I don't know whether its worth the wait Or if it's just millions of miles to re