 shoooootooootodoroki:
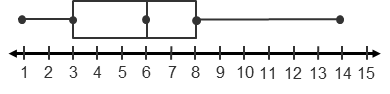
Use the box plot to complete the sentences. The median of the data is_____. The lower quartile is_____. The upper quartile is_____. The minimum value is_____. The maximum value is _____.
 shoooootooootodoroki:
the lovwer quartile is 3
Im sorry i can't help you I dont know much of this topic again im so sorry
shoooootooootodoroki:
its okay
 Convert:
\(\color{#0cbb34}{\text{Originally Posted by}}\) @shoooootooootodoroki the lovwer quartile is 3 \(\color{#0cbb34}{\text{End of Quote}}\) Yes that would be right, then what would the minimum be?
shoooootooootodoroki:
the minimum would be 1
Convert:
\(\color{#0cbb34}{\text{Originally Posted by}}\) @shoooootooootodoroki the minimum would be 1 \(\color{#0cbb34}{\text{End of Quote}}\) Yes! Good job. Then the median?
shoooootooootodoroki:
6
Convert:
\(\color{#0cbb34}{\text{Originally Posted by}}\) @shoooootooootodoroki 6 \(\color{#0cbb34}{\text{End of Quote}}\) Good job! You're getting it. And lastly the upper quartile and the maximum?
shoooootooootodoroki:
the upper quartile is 8 and the maximum is 14
Convert:
\(\color{#0cbb34}{\text{Originally Posted by}}\) @shoooootooootodoroki the upper quartile is 8 and the maximum is 14 \(\color{#0cbb34}{\text{End of Quote}}\) Yes! Now would you think you could do another one of these later by yourself if you do more in your class?
shoooootooootodoroki:
yes i think i got the hang of it
Convert:
\(\color{#0cbb34}{\text{Originally Posted by}}\) @shoooootooootodoroki yes i think i got the hang of it \(\color{#0cbb34}{\text{End of Quote}}\) Okay, well I'm glad 😁
Join our real-time social learning platform and learn together with your friends!
 natalieee:
who else wants a job in biology? I love biomedical science and want to work with
natalieee:
who else wants a job in biology? I love biomedical science and want to work with
 Twaylor:
Time flies doesn't it? I tried to not be the second squeaky wheel of the household and ended up hurting myself and others severely.
Twaylor:
Time flies doesn't it? I tried to not be the second squeaky wheel of the household and ended up hurting myself and others severely.
 clllaaaaaire:
any tips? the quality isn't the best because I am using this site on my computer
clllaaaaaire:
any tips? the quality isn't the best because I am using this site on my computer
 Midnight97:
Kinda a roleplay story between me and my friend enjoy... Part one Forgive me for all the screenshots.
Midnight97:
Kinda a roleplay story between me and my friend enjoy... Part one Forgive me for all the screenshots.
 StevenisGhost:
what type of song should I make next, and will y'all go check out my new song on
Midnight97:
My drawing sure changed over the years look at these two pictures from 2024 to no
StevenisGhost:
what type of song should I make next, and will y'all go check out my new song on
Midnight97:
My drawing sure changed over the years look at these two pictures from 2024 to no
 EdwinJsHispanic:
"poem" love is So Beautiful to have. But it's so hard to have. At this point I don't know whether its worth the wait Or if it's just millions of miles to re
EdwinJsHispanic:
"poem" love is So Beautiful to have. But it's so hard to have. At this point I don't know whether its worth the wait Or if it's just millions of miles to re
EdwinJsHispanic:
"poem" love is So Beautiful to have. But it's so hard to have. At this point I don't know whether its worth the wait Or if it's just millions of miles to re
EdwinJsHispanic:
"poem" love is So Beautiful to have. But it's so hard to have. At this point I don't know whether its worth the wait Or if it's just millions of miles to re