 Allison:
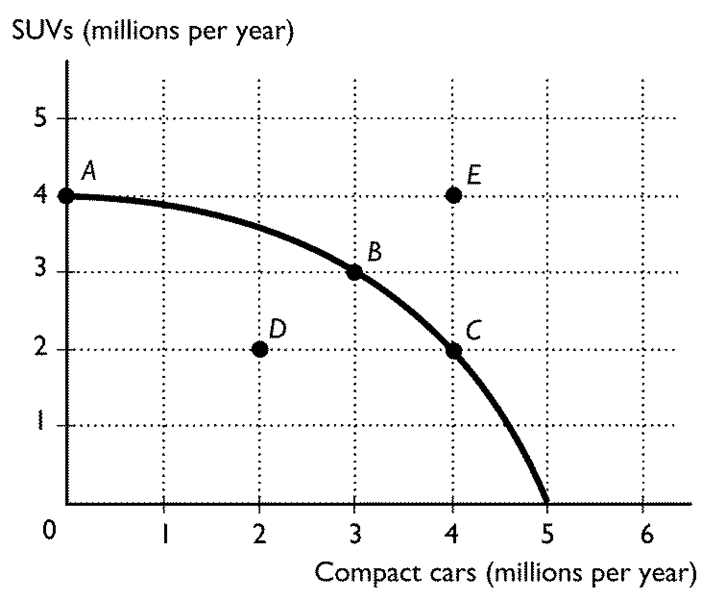
The figure shows the production possibilities frontier for a country. If the country is producing at point D, then the resources are being used efficiently. technology associated with producing SUVs and compact cars is advancing. resources are not being used efficiently and/or are unemployed. production of SUVs and compact cars is maximized.
 AZ:
AZ:
So to understand your graph We can make two kinds of cars an SUV or a compact car So we can make ONLY SUVs and that would be point A Or we can make ONLY compact cars and that would be at the end of the curve (5,0)
AZ:
Each car requires different resources- like different times to build the entire thing and material, etc So if you're making all the SUV's you can at point A, but now you want to start making compact cars Then you're taking away resources from the SUVs to make the compact cars But now you're producing compact cars
AZ:
Does that make sense so far?
AZ:
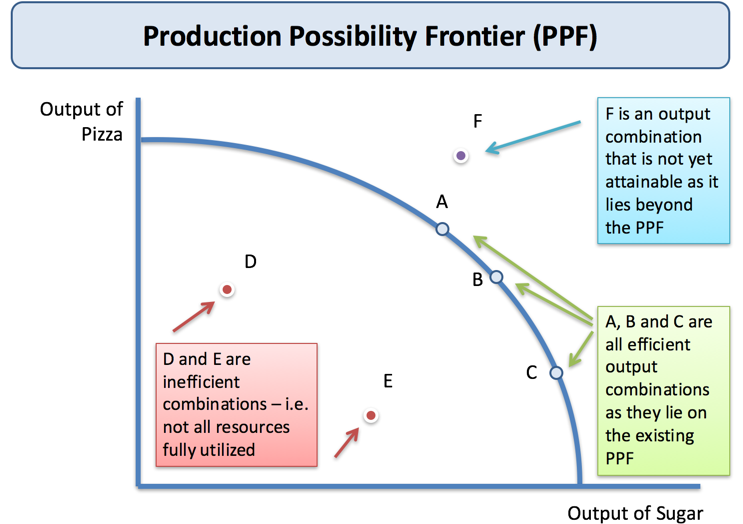
That should help you understand at least what the graph means. Now if you're along that line, like they said in your previous question, you're at optimal efficiency. If you're inside that line towards the left, you're being inefficient. If you're to the right of that line, it's not possible because you don't have enough resources to accomplish that
AZ:
So let's look back at your question now and I see that I might have helped you eliminate some answer choices lol, but now that you read all that- what's your answer?
Join our real-time social learning platform and learn together with your friends!
 Twaylor:
Time flies doesn't it? I tried to not be the second squeaky wheel of the household and ended up hurting myself and others severely.
Twaylor:
Time flies doesn't it? I tried to not be the second squeaky wheel of the household and ended up hurting myself and others severely.
 clllaaaaaire:
any tips? the quality isn't the best because I am using this site on my computer
clllaaaaaire:
any tips? the quality isn't the best because I am using this site on my computer
 Midnight97:
Kinda a roleplay story between me and my friend enjoy... Part one Forgive me for all the screenshots.
Midnight97:
Kinda a roleplay story between me and my friend enjoy... Part one Forgive me for all the screenshots.
 StevenisGhost:
what type of song should I make next, and will y'all go check out my new song on
Midnight97:
My drawing sure changed over the years look at these two pictures from 2024 to no
StevenisGhost:
what type of song should I make next, and will y'all go check out my new song on
Midnight97:
My drawing sure changed over the years look at these two pictures from 2024 to no
 EdwinJsHispanic:
"poem" love is So Beautiful to have. But it's so hard to have. At this point I don't know whether its worth the wait Or if it's just millions of miles to re
EdwinJsHispanic:
"poem" love is So Beautiful to have. But it's so hard to have. At this point I don't know whether its worth the wait Or if it's just millions of miles to re
EdwinJsHispanic:
"poem" love is So Beautiful to have. But it's so hard to have. At this point I don't know whether its worth the wait Or if it's just millions of miles to re
EdwinJsHispanic:
"poem" love is So Beautiful to have. But it's so hard to have. At this point I don't know whether its worth the wait Or if it's just millions of miles to re
 Breathless:
I don't know if this would be considered art, but its close enough I believe, Any
Breathless:
I don't know if this would be considered art, but its close enough I believe, Any