 lorena123:
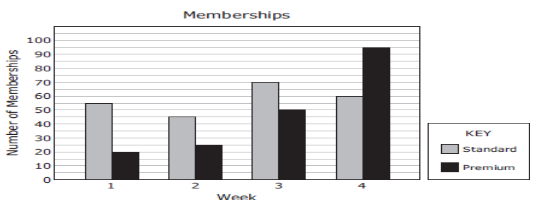
A club sold standard and premium memberships. The graph shows the number of each type of membership sold over the last four weeks. Which statement is supported by the information in the graph?
 lorena123:
F. The number of premium memberships sold during Week 4 was 75% more than the number of premium memberships sold during Week 1. G. The total number of memberships sold during Week 1 was equal to the total number of memberships sold during Week 2. H. The number of premium memberships sold during Week 3 was 2 times the number of premium memberships sold during Week 2. J. The total number of memberships sold during Week 4 was 35 less than the total number of memberships sold during Week 3.
lorena123:
@snowflake0531
lorena123:
@Hero
 snowflake0531:
percentages... okay, do you know what you're supposed to do for this problem? /how to do it?
lorena123:
No because they kind of taught us this like 1 day ago and now they gave us a test
snowflake0531:
ah oop well, they mainly want you to compare the premium memberships and the standard memberships. look at the bar graph, and compare the two, look through the answers and see which one has the right percentages
lorena123:
ok will do
Join our real-time social learning platform and learn together with your friends!
 Twaylor:
Time flies doesn't it? I tried to not be the second squeaky wheel of the household and ended up hurting myself and others severely.
Twaylor:
Time flies doesn't it? I tried to not be the second squeaky wheel of the household and ended up hurting myself and others severely.
 clllaaaaaire:
any tips? the quality isn't the best because I am using this site on my computer
clllaaaaaire:
any tips? the quality isn't the best because I am using this site on my computer
 Midnight97:
Kinda a roleplay story between me and my friend enjoy... Part one Forgive me for all the screenshots.
Midnight97:
Kinda a roleplay story between me and my friend enjoy... Part one Forgive me for all the screenshots.
 StevenisGhost:
what type of song should I make next, and will y'all go check out my new song on
Midnight97:
My drawing sure changed over the years look at these two pictures from 2024 to no
StevenisGhost:
what type of song should I make next, and will y'all go check out my new song on
Midnight97:
My drawing sure changed over the years look at these two pictures from 2024 to no
 EdwinJsHispanic:
"poem" love is So Beautiful to have. But it's so hard to have. At this point I don't know whether its worth the wait Or if it's just millions of miles to re
EdwinJsHispanic:
"poem" love is So Beautiful to have. But it's so hard to have. At this point I don't know whether its worth the wait Or if it's just millions of miles to re
EdwinJsHispanic:
"poem" love is So Beautiful to have. But it's so hard to have. At this point I don't know whether its worth the wait Or if it's just millions of miles to re
EdwinJsHispanic:
"poem" love is So Beautiful to have. But it's so hard to have. At this point I don't know whether its worth the wait Or if it's just millions of miles to re
 Breathless:
I don't know if this would be considered art, but its close enough I believe, Any
Breathless:
I don't know if this would be considered art, but its close enough I believe, Any