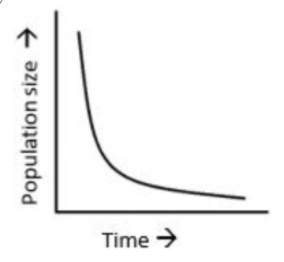
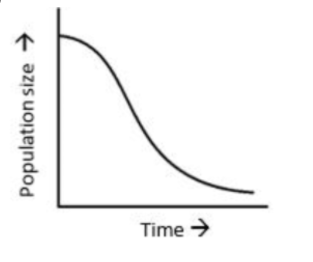
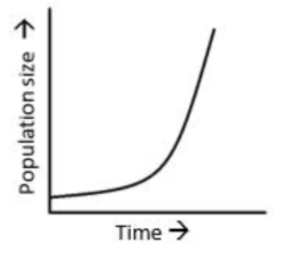
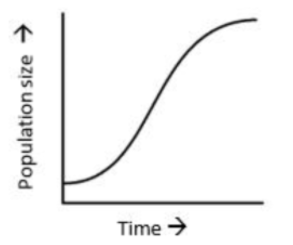
pls help :') A forest fire killed many of the rabbits in an area. Which of the following graphs best represents what would most likely happen to the rabbit population over a period of many years after the fire? let me attach the four pictures
 snowflake0531:
which ones can you immediately eliminate
i have no idea, i dont even know what those pictures are supposed to mean
snowflake0531:
after the fire, immediately after, do you think that there are a lot of rabbits or a little
definitely little
snowflake0531:
okay, so the start of the graph must be very low, which means you can eliminate which ones
the last 2 ones, c and d
snowflake0531:
do you mean that we should eliminate or keep them
eliminate loll
snowflake0531:
umm, why you just said that the amount of rabbits will be3 not-a-lot, so shouldnt' the start of the graph be low?
ok then so im guessing the answer is d
snowflake0531:
okay so eliminating a and b how'd you eliminate c
idk you said "low" so i automatically said eliminate c and d, but thats wrong so the answer d
snowflake0531:
no low means that it must be either c or d
\(\color{#0cbb34}{\text{Originally Posted by}}\) @Yellow the last 2 ones, c and d \(\color{#0cbb34}{\text{End of Quote}}\)
snowflake0531:
?_? yes, we keep the last 2 ones
then c? bro what do you want me to do
snowflake0531:
yes it's c lol
snowflake0531:
but you were guessing, but nvmd
i really wasnt guessing but alright
thanks though
snowflake0531:
loll
Join our real-time social learning platform and learn together with your friends!
 Twaylor:
Time flies doesn't it? I tried to not be the second squeaky wheel of the household and ended up hurting myself and others severely.
Twaylor:
Time flies doesn't it? I tried to not be the second squeaky wheel of the household and ended up hurting myself and others severely.
 clllaaaaaire:
any tips? the quality isn't the best because I am using this site on my computer
clllaaaaaire:
any tips? the quality isn't the best because I am using this site on my computer
 Midnight97:
Kinda a roleplay story between me and my friend enjoy... Part one Forgive me for all the screenshots.
Midnight97:
Kinda a roleplay story between me and my friend enjoy... Part one Forgive me for all the screenshots.
 StevenisGhost:
what type of song should I make next, and will y'all go check out my new song on
Midnight97:
My drawing sure changed over the years look at these two pictures from 2024 to no
StevenisGhost:
what type of song should I make next, and will y'all go check out my new song on
Midnight97:
My drawing sure changed over the years look at these two pictures from 2024 to no
 EdwinJsHispanic:
"poem" love is So Beautiful to have. But it's so hard to have. At this point I don't know whether its worth the wait Or if it's just millions of miles to re
EdwinJsHispanic:
"poem" love is So Beautiful to have. But it's so hard to have. At this point I don't know whether its worth the wait Or if it's just millions of miles to re
EdwinJsHispanic:
"poem" love is So Beautiful to have. But it's so hard to have. At this point I don't know whether its worth the wait Or if it's just millions of miles to re
EdwinJsHispanic:
"poem" love is So Beautiful to have. But it's so hard to have. At this point I don't know whether its worth the wait Or if it's just millions of miles to re
 Breathless:
I don't know if this would be considered art, but its close enough I believe, Any
Breathless:
I don't know if this would be considered art, but its close enough I believe, Any