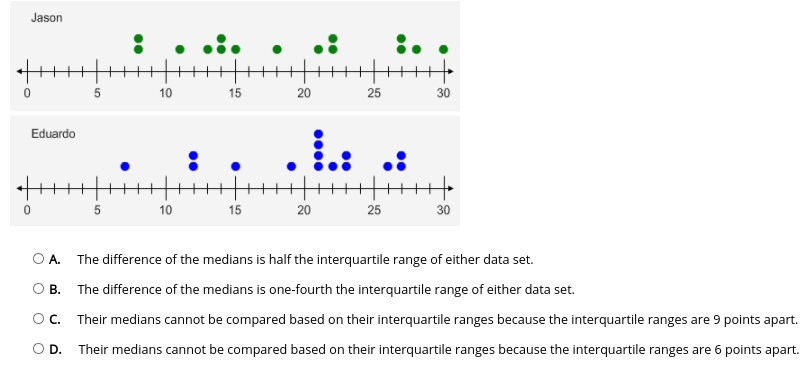
The dot plot shows the number of points scored by Jason and Eduardo during a middle school basketball season. Based on the dot plot, which statement about the medians and interquartile ranges of the data sets is true? The first comment will have the full question-
Help would be very much appreciated. :) Thanks
 simsharrison:
Do you know how to find median?
yes
simsharrison:
Do you know how to find interquartile ranges?
simsharrison:
If so, how?
Order the data from least to greatest, find the median, calculate the median of both the lower and upper half of the data, the IQR is the difference between the upper and lower medians.
simsharrison:
\(\color{#0cbb34}{\text{Originally Posted by}}\) @Bookworm Order the data from least to greatest, find the median, calculate the median of both the lower and upper half of the data, the IQR is the difference between the upper and lower medians. \(\color{#0cbb34}{\text{End of Quote}}\) nice job, but make sure to cite. :)
ok
simsharrison:
ok follow the directions on there, and then tell me what you get. I'll check your work for you.
ok
simsharrison:
@az any help on this one?
 TETSXPREME:
Are you finished with this or do you need any more help?
Join our real-time social learning platform and learn together with your friends!
 Twaylor:
Time flies doesn't it? I tried to not be the second squeaky wheel of the household and ended up hurting myself and others severely.
Twaylor:
Time flies doesn't it? I tried to not be the second squeaky wheel of the household and ended up hurting myself and others severely.
 clllaaaaaire:
any tips? the quality isn't the best because I am using this site on my computer
clllaaaaaire:
any tips? the quality isn't the best because I am using this site on my computer
 Midnight97:
Kinda a roleplay story between me and my friend enjoy... Part one Forgive me for all the screenshots.
Midnight97:
Kinda a roleplay story between me and my friend enjoy... Part one Forgive me for all the screenshots.
 StevenisGhost:
what type of song should I make next, and will y'all go check out my new song on
Midnight97:
My drawing sure changed over the years look at these two pictures from 2024 to no
StevenisGhost:
what type of song should I make next, and will y'all go check out my new song on
Midnight97:
My drawing sure changed over the years look at these two pictures from 2024 to no
 EdwinJsHispanic:
"poem" love is So Beautiful to have. But it's so hard to have. At this point I don't know whether its worth the wait Or if it's just millions of miles to re
EdwinJsHispanic:
"poem" love is So Beautiful to have. But it's so hard to have. At this point I don't know whether its worth the wait Or if it's just millions of miles to re
EdwinJsHispanic:
"poem" love is So Beautiful to have. But it's so hard to have. At this point I don't know whether its worth the wait Or if it's just millions of miles to re
EdwinJsHispanic:
"poem" love is So Beautiful to have. But it's so hard to have. At this point I don't know whether its worth the wait Or if it's just millions of miles to re
 Breathless:
I don't know if this would be considered art, but its close enough I believe, Any
Breathless:
I don't know if this would be considered art, but its close enough I believe, Any