 AthenaSaige:
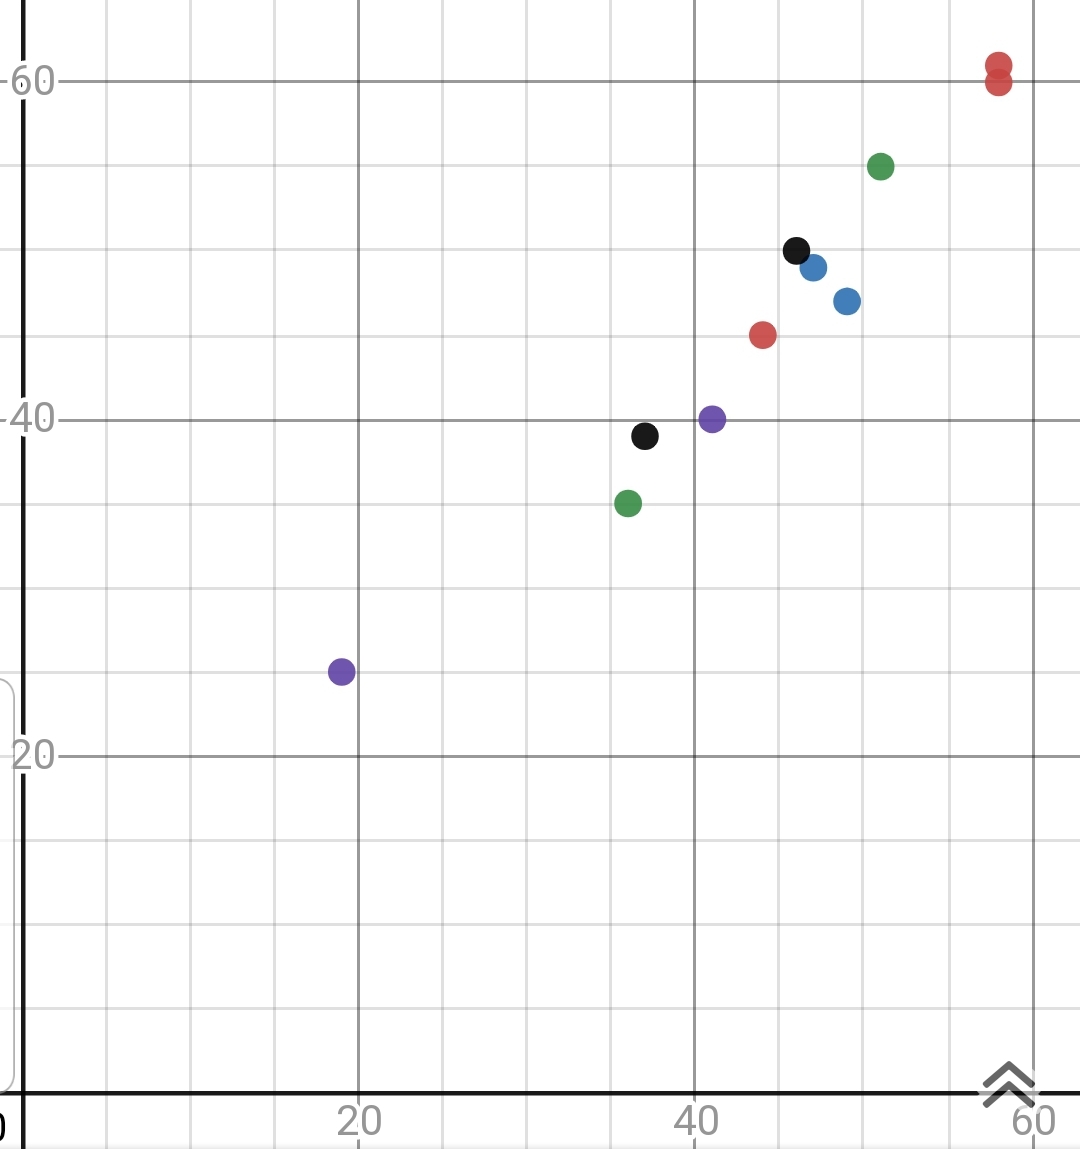
What would the line of Best fit and the slope intercept form be for this scatter plot
 KynxKatz:
Can you take a full screenshot of the Graph
 AZ:
AZ:
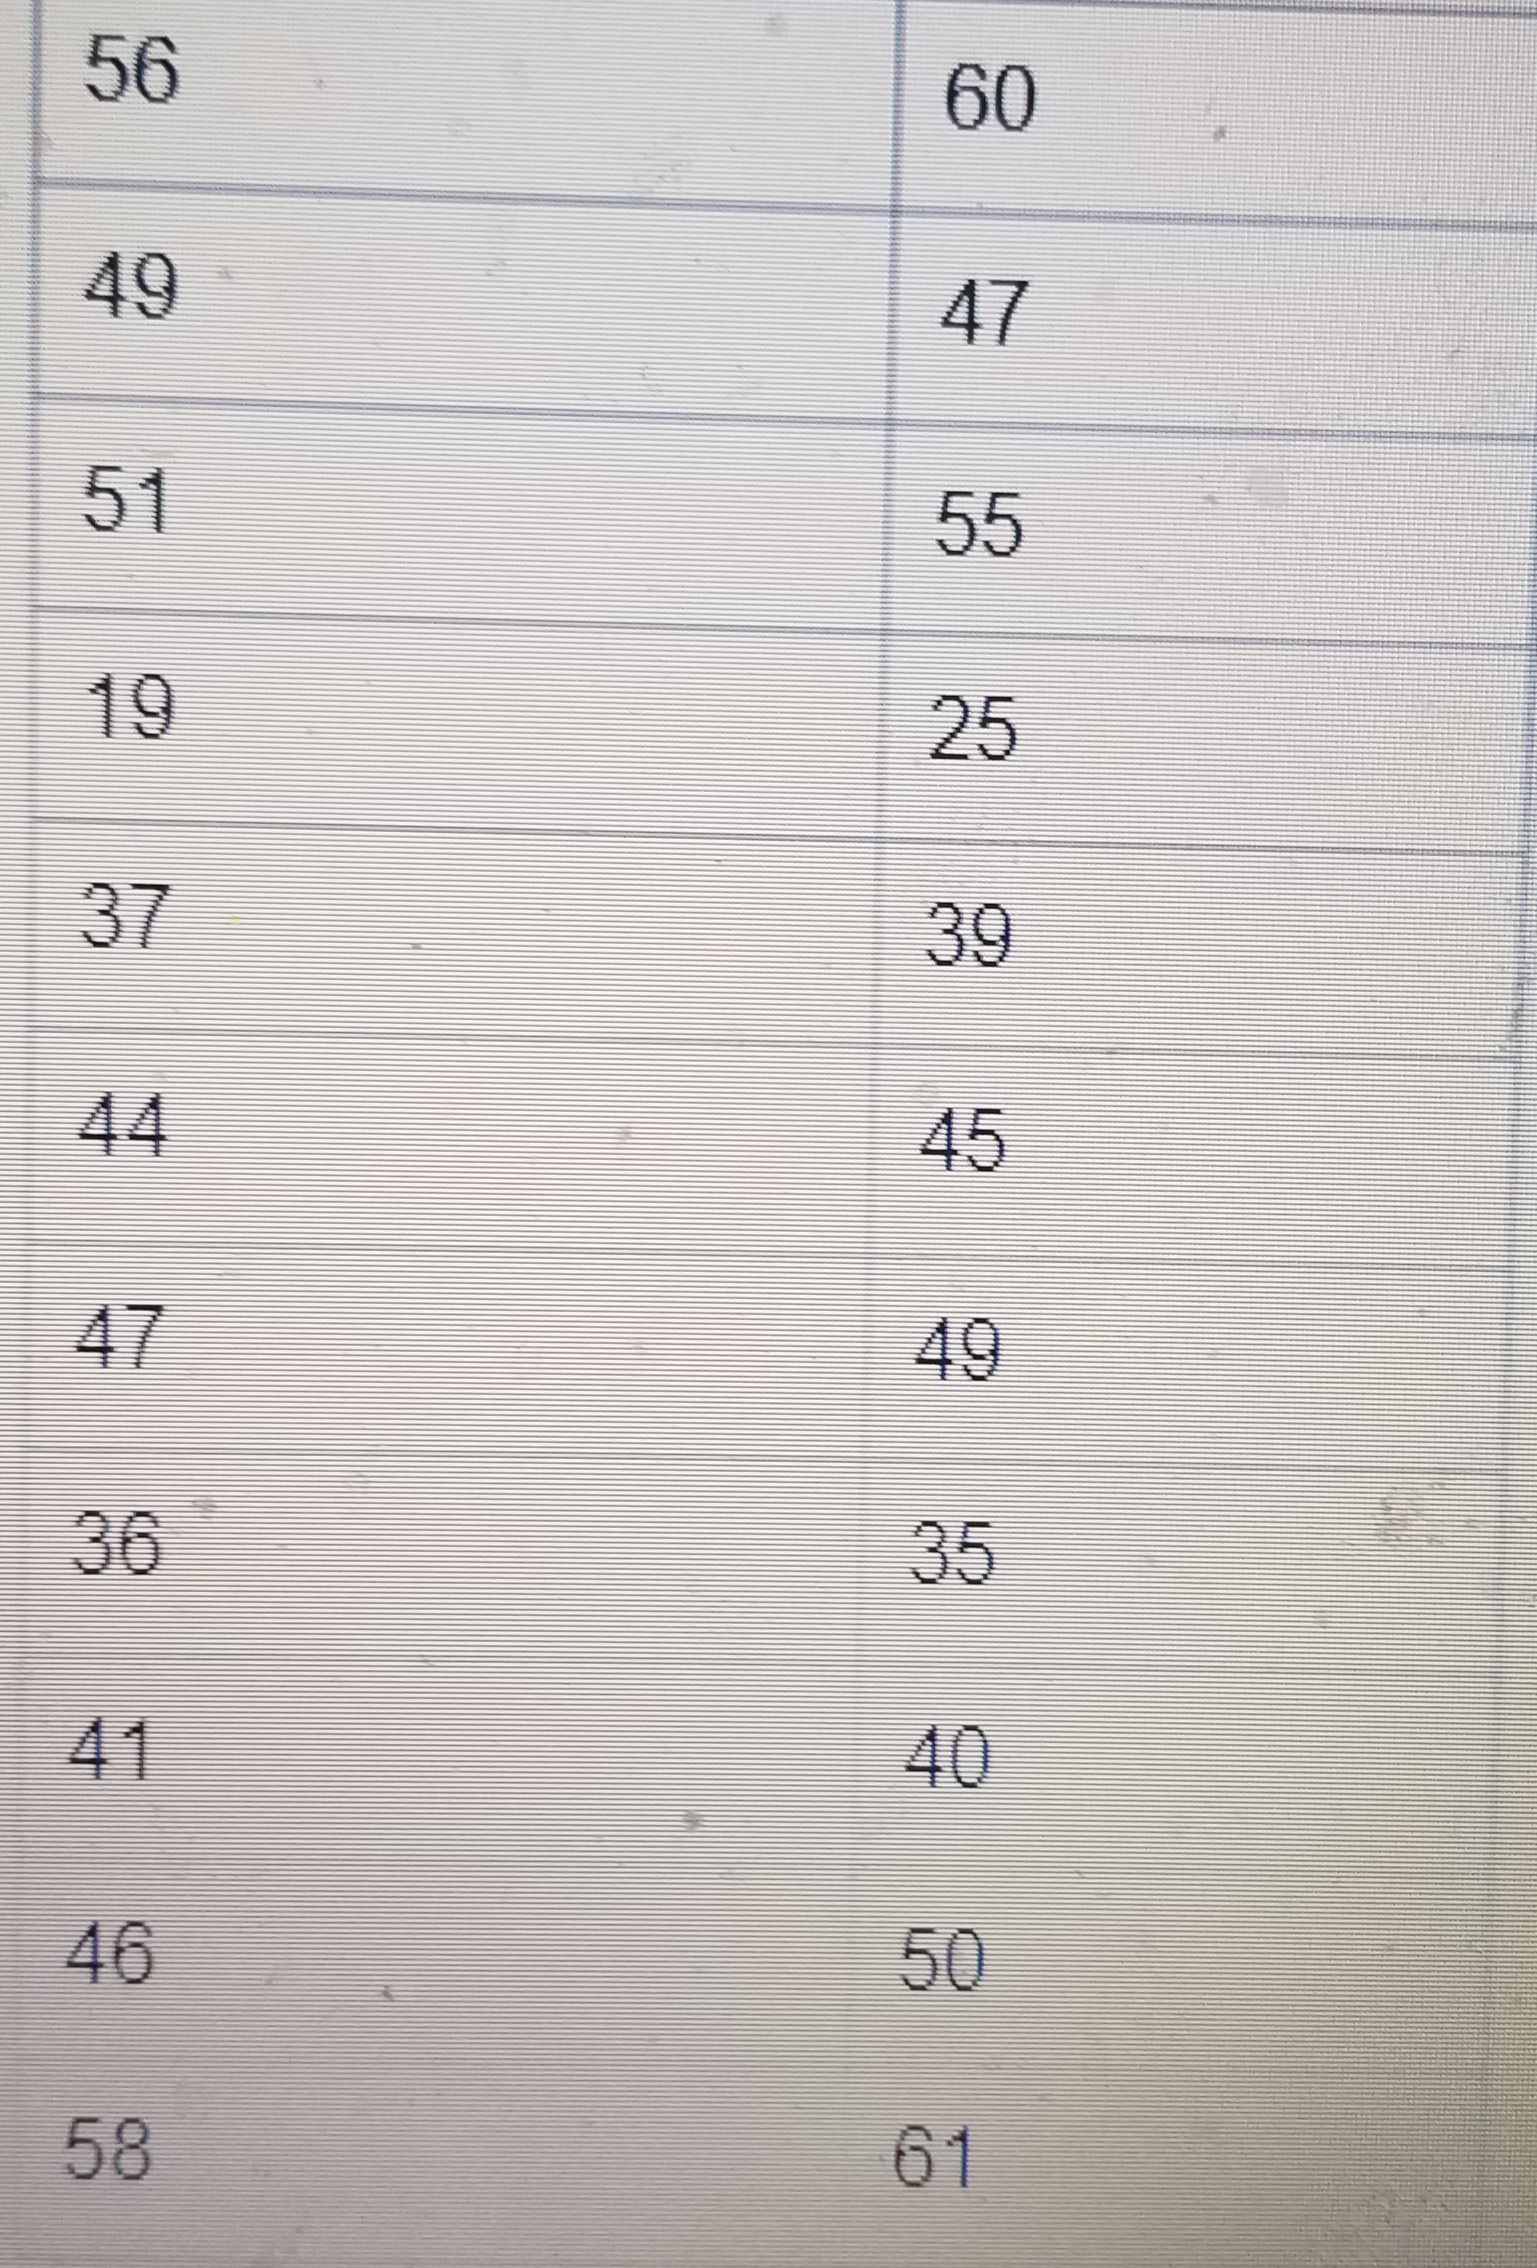
I recognize that as a screenshot from Desmos. Can you provide us with the exact value of those points? We can use Excel to graph the line of best fit and determine the slope-intercept form for the line of best fit. (I'm not sure if they're expecting you to just manually calculate the line of best fit based on observation or if they want a precise answer, however the exact points would be helpful regardless)
Calculate the best fit put the line in the middle also show the full screen shot.
 AZ:
AZ:
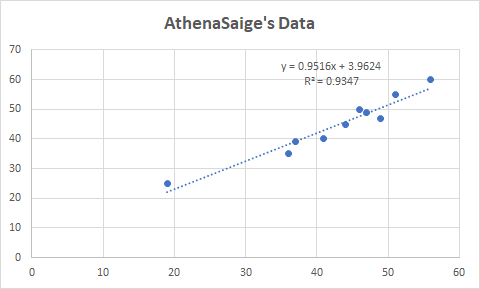
You can use this calculator online to calculate the linear regression line (basically the line of best fit) https://www.socscistatistics.com/tests/regression/default.aspx
AZ:
I plugged it into Excel and it gave me the same line of best fit so it's calculating it using the least squares method
 AthenaSaige:
thank you! You are AWESOME
AZ:
You're welcome! Glad I could help :)
Join our real-time social learning platform and learn together with your friends!
 Twaylor:
Time flies doesn't it? I tried to not be the second squeaky wheel of the household and ended up hurting myself and others severely.
Twaylor:
Time flies doesn't it? I tried to not be the second squeaky wheel of the household and ended up hurting myself and others severely.
 clllaaaaaire:
any tips? the quality isn't the best because I am using this site on my computer
clllaaaaaire:
any tips? the quality isn't the best because I am using this site on my computer
 Midnight97:
Kinda a roleplay story between me and my friend enjoy... Part one Forgive me for all the screenshots.
Midnight97:
Kinda a roleplay story between me and my friend enjoy... Part one Forgive me for all the screenshots.
 StevenisGhost:
what type of song should I make next, and will y'all go check out my new song on
Midnight97:
My drawing sure changed over the years look at these two pictures from 2024 to no
StevenisGhost:
what type of song should I make next, and will y'all go check out my new song on
Midnight97:
My drawing sure changed over the years look at these two pictures from 2024 to no
 EdwinJsHispanic:
"poem" love is So Beautiful to have. But it's so hard to have. At this point I don't know whether its worth the wait Or if it's just millions of miles to re
EdwinJsHispanic:
"poem" love is So Beautiful to have. But it's so hard to have. At this point I don't know whether its worth the wait Or if it's just millions of miles to re
EdwinJsHispanic:
"poem" love is So Beautiful to have. But it's so hard to have. At this point I don't know whether its worth the wait Or if it's just millions of miles to re
EdwinJsHispanic:
"poem" love is So Beautiful to have. But it's so hard to have. At this point I don't know whether its worth the wait Or if it's just millions of miles to re
 Breathless:
I don't know if this would be considered art, but its close enough I believe, Any
Breathless:
I don't know if this would be considered art, but its close enough I believe, Any