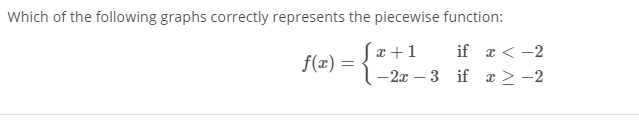
math problem

 MxxnLight:
@supie / @jhonyy9 ?
 AZ:
AZ:
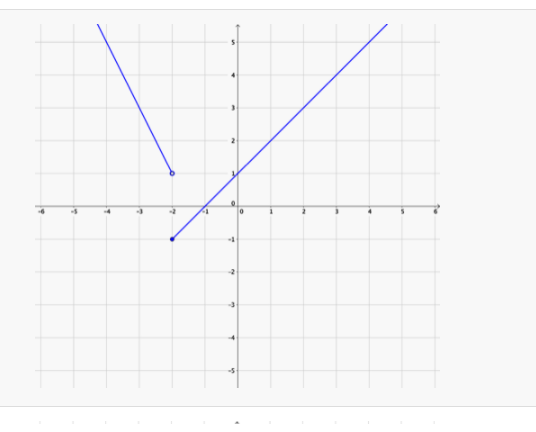
so when you have x is less than -2 the graph looks like x + 1 and for all values of x greater than or equal to -2 the graph looks like -2x - 3 so which graph depicts that?
B?
AZ:
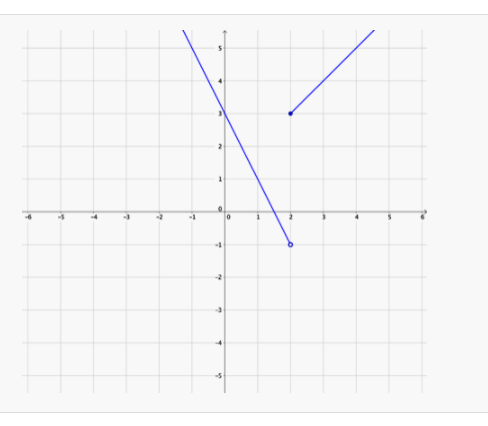
Is this B? Because if so, that is wrong. Just look at the line on the left side. It's going down so that means it has a negative slope The equation says that the line should be x + 1 when the x-values are all less than -2 so that means on the left side, the line should be going up and it would have a y-intercept of 1 if it reached the y-axis (but it doesn't reach the y-axis because it has to stop at -2) and then from -2 to the other end, we have an equation of -2x - 3 this has a negative slope and an y-intercept of -3
yep
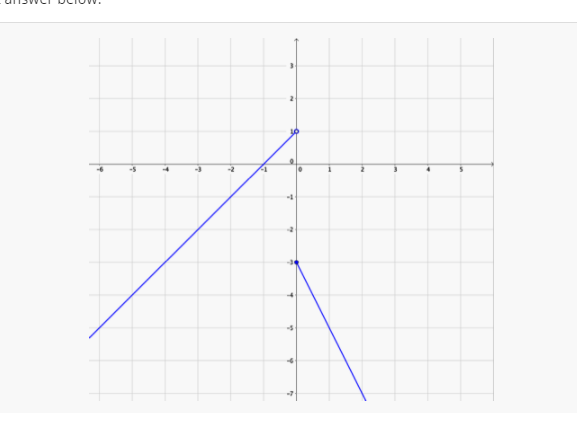
its A?
AZ:
are you sure? the lines look correct but remember what the possible x-values were? the line is going to be x+1 for whenever x is LESS THAN -2 but in A, the line keeps going all the way until 0
AZ:
and the other line should begin at x = -2 and go on but it begins at 0
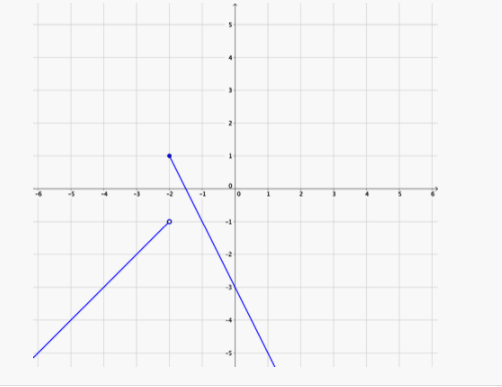
the last option is c because its the last option ith the slope going up
AZ:
yes, now you got it also if you want to know how to put the lines into Desmos to check, this is how you would write it: https://www.desmos.com/calculator/wol1rs1hwc you write the equation and then in between { } you write down what x-values those equations work for so the equation of the line would be x+1 whenever x is less than -2 or x<-2 so you would put in x+1 {x<-2} and it'll show you that
AZ:
did all of that make sense?
yep
AZ:
good
Join our real-time social learning platform and learn together with your friends!
 Twaylor:
Time flies doesn't it? I tried to not be the second squeaky wheel of the household and ended up hurting myself and others severely.
Twaylor:
Time flies doesn't it? I tried to not be the second squeaky wheel of the household and ended up hurting myself and others severely.
 clllaaaaaire:
any tips? the quality isn't the best because I am using this site on my computer
clllaaaaaire:
any tips? the quality isn't the best because I am using this site on my computer
 Midnight97:
Kinda a roleplay story between me and my friend enjoy... Part one Forgive me for all the screenshots.
Midnight97:
Kinda a roleplay story between me and my friend enjoy... Part one Forgive me for all the screenshots.
 StevenisGhost:
what type of song should I make next, and will y'all go check out my new song on
Midnight97:
My drawing sure changed over the years look at these two pictures from 2024 to no
StevenisGhost:
what type of song should I make next, and will y'all go check out my new song on
Midnight97:
My drawing sure changed over the years look at these two pictures from 2024 to no
 EdwinJsHispanic:
"poem" love is So Beautiful to have. But it's so hard to have. At this point I don't know whether its worth the wait Or if it's just millions of miles to re
EdwinJsHispanic:
"poem" love is So Beautiful to have. But it's so hard to have. At this point I don't know whether its worth the wait Or if it's just millions of miles to re
EdwinJsHispanic:
"poem" love is So Beautiful to have. But it's so hard to have. At this point I don't know whether its worth the wait Or if it's just millions of miles to re
EdwinJsHispanic:
"poem" love is So Beautiful to have. But it's so hard to have. At this point I don't know whether its worth the wait Or if it's just millions of miles to re
 Breathless:
I don't know if this would be considered art, but its close enough I believe, Any
Breathless:
I don't know if this would be considered art, but its close enough I believe, Any