 DADDYROXY:
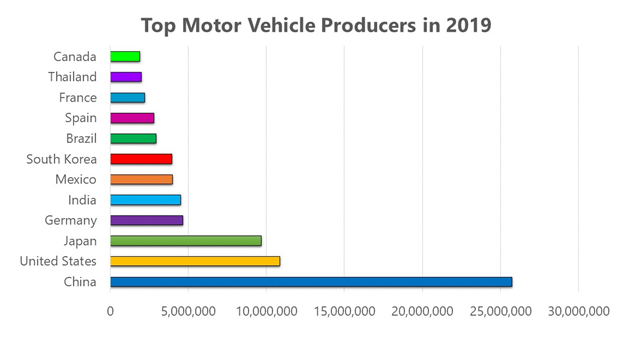
A. Define economic globalization. B. Describe how this graph would be different if it showed the top automobile-producing countries at the beginning of the 20th century. C. Identify TWO geographic patterns indicated in the graph of the top automobile-producing countries in 2019. D. Explain TWO reasons for the geographic patterns that you identified in Part C. E. Explain how industrial location may have led to the changes in the geographic patterns of automobile production.
 QuestionCoveBot:
A. Economic globalization: https://www.un.org/en/development/desa/policy/cdp/cdp_background_papers/bp2000_1.pdf
DADDYROXY:
Yea I did that
QuestionCoveBot:
So now, hopefully you have answered A. :) B. 20th century. What main events happened in the century?
DADDYROXY:
idk
QuestionCoveBot:
I will give you two timelines... just hold on for a little.
QuestionCoveBot:
July 28th, 1914 - November 11th, 1918 ~ World War 1 September 1st, 1939 - September 2nd, 1945 ~ World War 2 1947 - 1991 ~ Cold War November 1st, 1955 - April 30th, 1975 ~ Vietnam War June 25th, 1950 - July 27th, 1953 ~ Korean War Okay, maybe 5 timelines. But still.
DADDYROXY:
Ok
QuestionCoveBot:
This is still for B. In WWI (World War 1), there were no cars, so you can eliminate the first 20 years of the 20th century. In WWII (World War 2), there were cars. As expected, only these countries could produce them (may be more, but not enough production); United States Britain (UK) China Japan Germany These are the top 5 producers of vehicles. It is not in order. In order, it looks like; 1. United States 2. Britain (UK) 3. Germany 4. Japan 5. China The next couple countries would be... 6. France 7. Soviet Union 8. Italy 9. Korea (part of Japan) 10. Austria-Hungary Empire 11. Canada 12. Ottoman Empire (Turkey)
DADDYROXY:
So I write that?
QuestionCoveBot:
Al you write is this... 1. United States 2. Britain (UK) 3. Germany 4. Japan 5. China 6. France 7. Soviet Union 8. Italy 9. Korea (part of Japan) 10. Austria-Hungary Empire 11. Canada 12. Ottoman Empire (Turkey)
DADDYROXY:
Ok
QuestionCoveBot:
Now for C. ._. What do you see about the top producing countries?
 LKylie:
bruhh wht grade u in?
DADDYROXY:
9
QuestionCoveBot:
._. I'm in freshman- anyways..... Roxy, what is TWO geographic patterns indicated in the graph of the top automobile-producing countries in 2019?
LKylie:
\(\color{#0cbb34}{\text{Originally Posted by}}\) @DADDYROXY 9 \(\color{#0cbb34}{\text{End of Quote}}\) oh im in 8th
DADDYROXY:
lmao idkkkk
QuestionCoveBot:
Think of is as this way... China- large, rich, oil-rich, #1 producer of almost everything has- desert, cold regions, mountains, etc. US- large, rich, oil-rich, #2 producer of almost everything has- desert, cold regions, mountains, etc. Each China and the US are very similar in geographic-wise.
DADDYROXY:
ohhh
DADDYROXY:
Did you get that off the internet?
QuestionCoveBot:
Now do that for the rest of the countries on the chart (if you do not know something from it- I will tell you). No, not off internet. Off my mind. I am very smart in geographic stuff.
DADDYROXY:
oh ok
QuestionCoveBot:
Yeah- I learn all this stuff quite easy, tbh.
DADDYROXY:
sorry I'm doing many stuff at the same time
DADDYROXY:
oh wow thats good
QuestionCoveBot:
It is fine. I am too.
DADDYROXY:
Ok thanks
QuestionCoveBot:
Your welcome.
DADDYROXY:
I did C already.
QuestionCoveBot:
Okay. Now time for D... e.e The two reasons why is because... 1. All these countries get a high amount of oil, rock, etc. 2. Making things like vehicles requires certain things, and money is needed a lot for this making, so therefore, you get the two top countries as the US and China. The very richest countries both in oil and money.
DADDYROXY:
Got it
QuestionCoveBot:
Good. Are you able to get E without my help with the info I have provided?
DADDYROXY:
Yes thank you!
QuestionCoveBot:
Your welcome! :)
Join our real-time social learning platform and learn together with your friends!
 natalieee:
who else wants a job in biology? I love biomedical science and want to work with
natalieee:
who else wants a job in biology? I love biomedical science and want to work with
 Twaylor:
Time flies doesn't it? I tried to not be the second squeaky wheel of the household and ended up hurting myself and others severely.
Twaylor:
Time flies doesn't it? I tried to not be the second squeaky wheel of the household and ended up hurting myself and others severely.
 clllaaaaaire:
any tips? the quality isn't the best because I am using this site on my computer
clllaaaaaire:
any tips? the quality isn't the best because I am using this site on my computer
 Midnight97:
Kinda a roleplay story between me and my friend enjoy... Part one Forgive me for all the screenshots.
Midnight97:
Kinda a roleplay story between me and my friend enjoy... Part one Forgive me for all the screenshots.
 StevenisGhost:
what type of song should I make next, and will y'all go check out my new song on
Midnight97:
My drawing sure changed over the years look at these two pictures from 2024 to no
StevenisGhost:
what type of song should I make next, and will y'all go check out my new song on
Midnight97:
My drawing sure changed over the years look at these two pictures from 2024 to no
 EdwinJsHispanic:
"poem" love is So Beautiful to have. But it's so hard to have. At this point I don't know whether its worth the wait Or if it's just millions of miles to re
EdwinJsHispanic:
"poem" love is So Beautiful to have. But it's so hard to have. At this point I don't know whether its worth the wait Or if it's just millions of miles to re
EdwinJsHispanic:
"poem" love is So Beautiful to have. But it's so hard to have. At this point I don't know whether its worth the wait Or if it's just millions of miles to re
EdwinJsHispanic:
"poem" love is So Beautiful to have. But it's so hard to have. At this point I don't know whether its worth the wait Or if it's just millions of miles to re