 TETSXPREME:
Help o;
 Shawnte:
Hey, Im Shawnte'. I can assist you with this, so we are going to be identifying simmilar averages.......and i can help you do that
 aquire:
I will also help
Shawnte:
So we neeed to find the average of these 4 graphs, and we need to identify which graph has the same average is the one in the display
aquire:
not average right Shwante
aquire:
it's mean absolute deviation
Shawnte:
mean and average are the same thing
aquire:
yes
aquire:
but mean absolute deviation is a different thing
Shawnte:
some people go by average some people go byy mean.........please do not correct me if you dont know what you talking about.......HUGE PET PEAVE
aquire:
this is about how data is spread out not around where
TETSXPREME:
i dont get it ._.
aquire:
have you heard the term?
TETSXPREME:
what term?
aquire:
mean absolute deviation?
TETSXPREME:
No whats the meaning
aquire:
let's decode one by one shall we?
TETSXPREME:
Yesh
aquire:
ok. what do you think mean means?
aquire:
(pun intended)
TETSXPREME:
mean in math way? o:
aquire:
yup
aquire:
:D
TETSXPREME:
just add all the numbers together and then divide it by how much numbers there is
aquire:
correct
aquire:
what does absolute mean
TETSXPREME:
so what now?
aquire:
^
TETSXPREME:
absolute mean i dont know what that is
aquire:
what is the absolute value of -2?
TETSXPREME:
i dont know e.e
TETSXPREME:
how do i figure that out?
aquire:
absolute value is just the quntity
aquire:
*quantity
TETSXPREME:
what does quantity means?
aquire:
the answer to "how much"
aquire:
or "how many"
 Baku:
Baku:
:l how do i help im stupid
 jhonyy9:
@TETSXPREME do you have any idea from these choices what maybe the same ?
aquire:
I think jhonny will take you from here. bye @TETSXPREME sorry for abandoning you in the middle.
jhonyy9:
@aquire then you wan you can continue but give any idea to help step by step - please
TETSXPREME:
seems a lil confusing
aquire:
ok then
aquire:
i will give you some examples
TETSXPREME:
Alr
aquire:
absolute value of -2 is 2 absolute value of 2 is 2 absolute value of -5 is 5 so you can say an absolute value of a number is just the number without the sign we denote it with \(|x|\). this means the absolute value of \(x\) for example with signs we can say \(|-2|=2\)
aquire:
do you understand?
 AZ:
AZ:
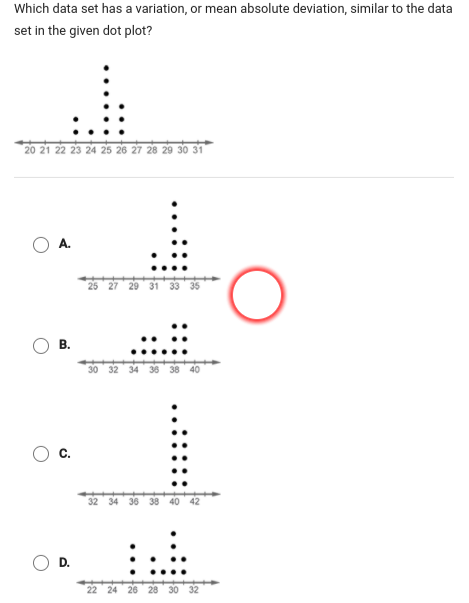
This is exactly like the question we answered earlier The mean absolute deviation tells you how much on average all the numbers DEVIATE or change from the mean and it tells you the absolute value of that
AZ:
Just look at the graphs which one has the same exact distribution? Sure the numbers are different on that graph that tells you it has a different mean than the graph in your question but the numbers are arranged in the same exact order which tells you that the average absolute value that each number is away from the mean is going to be the same as the one in the original question
TETSXPREME:
so i just did what i did last time basically?
AZ:
yes
TETSXPREME:
what about the dots that are not in a whole number?
AZ:
Just because the numbers aren't listed doesn't mean they don't exist but also there's only whole numbers listed in each answer choice
TETSXPREME:
but some is like half of the number tho
TETSXPREME:
but there is some thats ike half of a number
 Tonycoolkid21:
👍🏼
AZ:
...?? look at A for example |dw:1617047005063:dw| the ones that don't have a number are going to be numbers in between so the first one is 32 and the other one is 34
AZ:
|dw:1617047053019:dw|
Tonycoolkid21:
yes 👍🏼
TETSXPREME:
\(\color{#0cbb34}{\text{Originally Posted by}}\) @AZ ...?? look at A for example Created with RaphaëlReply Using Drawing the ones that don't have a number are going to be numbers in between so the first one is 32 and the other one is 34 \(\color{#0cbb34}{\text{End of Quote}}\) Ohhh i didnt realized that tyy
Tonycoolkid21:
teacher az the best 👍🏼
TETSXPREME:
@Az the answer is A?
Tonycoolkid21:
@AZ help her
AZ:
\(\color{#0cbb34}{\text{Originally Posted by}}\) @TETSXPREME @Az the answer is A? \(\color{#0cbb34}{\text{End of Quote}}\) yes
TETSXPREME:
Tysmm C:
Tonycoolkid21:
thx teacher AZ
AZ:
you're welcome (:
Join our real-time social learning platform and learn together with your friends!
 Twaylor:
Time flies doesn't it? I tried to not be the second squeaky wheel of the household and ended up hurting myself and others severely.
Twaylor:
Time flies doesn't it? I tried to not be the second squeaky wheel of the household and ended up hurting myself and others severely.
 clllaaaaaire:
any tips? the quality isn't the best because I am using this site on my computer
clllaaaaaire:
any tips? the quality isn't the best because I am using this site on my computer
 Midnight97:
Kinda a roleplay story between me and my friend enjoy... Part one Forgive me for all the screenshots.
Midnight97:
Kinda a roleplay story between me and my friend enjoy... Part one Forgive me for all the screenshots.
 StevenisGhost:
what type of song should I make next, and will y'all go check out my new song on
Midnight97:
My drawing sure changed over the years look at these two pictures from 2024 to no
StevenisGhost:
what type of song should I make next, and will y'all go check out my new song on
Midnight97:
My drawing sure changed over the years look at these two pictures from 2024 to no
 EdwinJsHispanic:
"poem" love is So Beautiful to have. But it's so hard to have. At this point I don't know whether its worth the wait Or if it's just millions of miles to re
EdwinJsHispanic:
"poem" love is So Beautiful to have. But it's so hard to have. At this point I don't know whether its worth the wait Or if it's just millions of miles to re
EdwinJsHispanic:
"poem" love is So Beautiful to have. But it's so hard to have. At this point I don't know whether its worth the wait Or if it's just millions of miles to re
EdwinJsHispanic:
"poem" love is So Beautiful to have. But it's so hard to have. At this point I don't know whether its worth the wait Or if it's just millions of miles to re
 Breathless:
I don't know if this would be considered art, but its close enough I believe, Any
Breathless:
I don't know if this would be considered art, but its close enough I believe, Any