 bralyn:
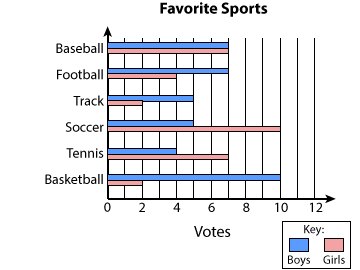
The bar graph shows some favorite sports of third-grade students. Which statement is true? Horizontal bar graph titled Favorite Sports has sport names on the y-axis and numbers from 0 to 12 by twos on the x-axis, labeled Votes. Each sport has bars in 2 colors. A key indicates the top color is boys and the bottom color is girls. Sports and both values are given. Baseball, 7 boys, 7 girls. Football, 7 boys, 4 girls. Track, 5 boys, 2 girls. Soccer, 5 boys, 10 girls. Tennis, 4 boys, 7 girls. Basketball, 10 boys, 2 girls. CLEAR CHECK More boys than girls voted for each one of the sports. Twice as many boys voted for basketball than for track. Four more boys voted for football than for track. The girls had 3 fewer votes for tennis than the boys.
 bralyn:
this is a comuttiy questoin
bralyn:
dont mind my slang
bralyn:
@Icyhot @snowflake0531 @@Ultrilliam @supie @sophia333
 snowflake0531:
Look through each of them For example, look at the first one Is it true that more boys voted/ add all the stuff together, and see
Join our real-time social learning platform and learn together with your friends!
 Twaylor:
Time flies doesn't it? I tried to not be the second squeaky wheel of the household and ended up hurting myself and others severely.
Twaylor:
Time flies doesn't it? I tried to not be the second squeaky wheel of the household and ended up hurting myself and others severely.
 clllaaaaaire:
any tips? the quality isn't the best because I am using this site on my computer
clllaaaaaire:
any tips? the quality isn't the best because I am using this site on my computer
 Midnight97:
Kinda a roleplay story between me and my friend enjoy... Part one Forgive me for all the screenshots.
Midnight97:
Kinda a roleplay story between me and my friend enjoy... Part one Forgive me for all the screenshots.
 StevenisGhost:
what type of song should I make next, and will y'all go check out my new song on
Midnight97:
My drawing sure changed over the years look at these two pictures from 2024 to no
StevenisGhost:
what type of song should I make next, and will y'all go check out my new song on
Midnight97:
My drawing sure changed over the years look at these two pictures from 2024 to no
 EdwinJsHispanic:
"poem" love is So Beautiful to have. But it's so hard to have. At this point I don't know whether its worth the wait Or if it's just millions of miles to re
EdwinJsHispanic:
"poem" love is So Beautiful to have. But it's so hard to have. At this point I don't know whether its worth the wait Or if it's just millions of miles to re
EdwinJsHispanic:
"poem" love is So Beautiful to have. But it's so hard to have. At this point I don't know whether its worth the wait Or if it's just millions of miles to re
EdwinJsHispanic:
"poem" love is So Beautiful to have. But it's so hard to have. At this point I don't know whether its worth the wait Or if it's just millions of miles to re
 Breathless:
I don't know if this would be considered art, but its close enough I believe, Any
Breathless:
I don't know if this would be considered art, but its close enough I believe, Any