 Rx1nyDxyz:
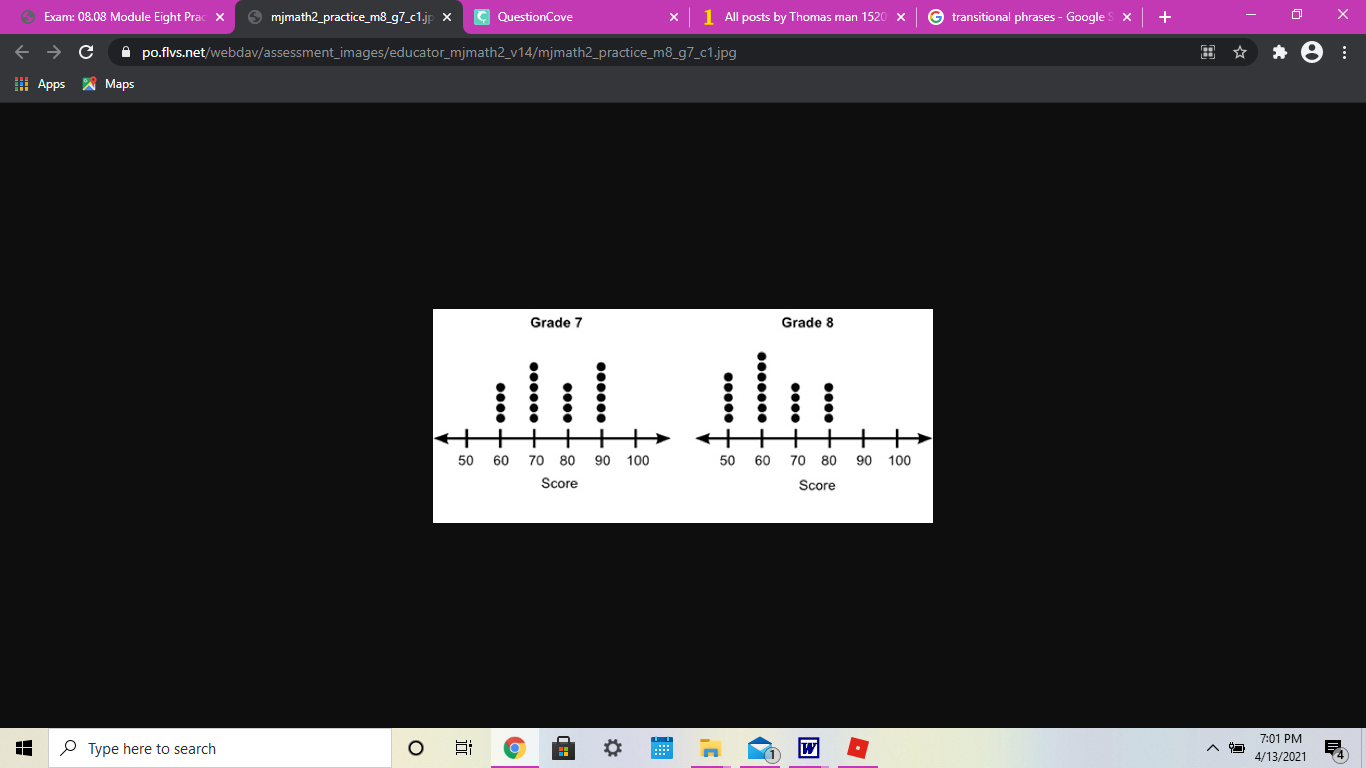
Help plz. The dot plots below show the test scores of seventh- and eighth-grade students: (The link has the picture) https://po.flvs.net/webdav/assessment_images/educator_mjmath2_v14/mjmath2_practice_m8_g7_c1.jpg Based on visual inspection of the dot plots, which grade, if any, appears to have the higher mean score? A:Grade 7 B:Grade 8 C:Both groups show about the same mean score. D:No conclusion about mean score can be made from the data.
 sophia333:
Could you please send a screenshot of the pic? I cannot view the link.
Rx1nyDxyz:
Ok!
 Shawnte:
same ss would b helpful
 Rx1nyDxyz:
Sorry for the wait, my internet is extermely slow.
Shawnte:
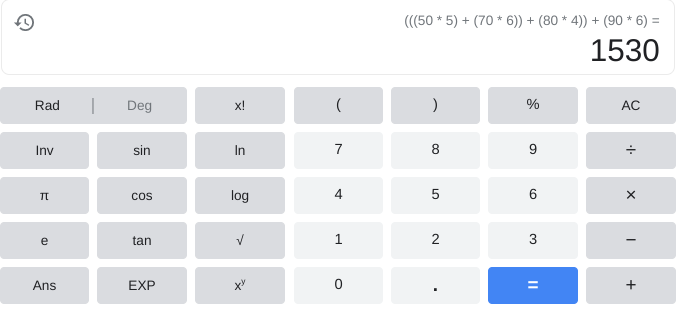
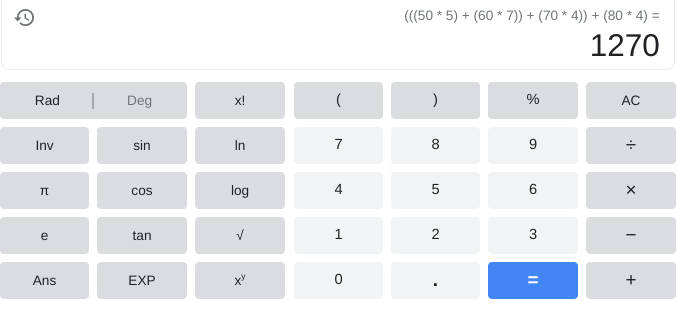
Okay so first thing we need to do is find the mean!
Shawnte:
Do you know how to do that?
Rx1nyDxyz:
I believe so. You average up all the numbers, correct?
Yes! you do! Im shawnte btw i went to go check my messages here i come
Rx1nyDxyz:
Oh, ok! I averaged them all, and i got the 1st option. Is that correct?
Shawnte:
Let me check rq
Rx1nyDxyz:
Oki
 Shawnte:
thats the first answer correct is that what u calculated to
Rx1nyDxyz:
Yeah i did that on a separate calculator i have.
Rx1nyDxyz:
Also, i have a couple more questions i'm stuck on. Could you help me with those?
 Shawnte:
Yes and those are the caluclations for the means.....now just solve the question i will walk you through it
Shawnte:
So we clearly see the 7th grade class has higher mean right?
Rx1nyDxyz:
Yes
Shawnte:
so therefor what is our answer
Rx1nyDxyz:
Grade 7, right?
Shawnte:
Yes so option A
Rx1nyDxyz:
Thank you! I had a feeling that was it, i just needed a 2nd opinion. Also, I have about 2 or 3 more questions i'm stuck on, can i tag you in them?
Rx1nyDxyz:
*Instead of writing the question here
Shawnte:
Ofc u can go ahead. Im always here
Rx1nyDxyz:
Ok, thank you! :)
Join our real-time social learning platform and learn together with your friends!
 natalieee:
who else wants a job in biology? I love biomedical science and want to work with
natalieee:
who else wants a job in biology? I love biomedical science and want to work with
 Twaylor:
Time flies doesn't it? I tried to not be the second squeaky wheel of the household and ended up hurting myself and others severely.
Twaylor:
Time flies doesn't it? I tried to not be the second squeaky wheel of the household and ended up hurting myself and others severely.
 clllaaaaaire:
any tips? the quality isn't the best because I am using this site on my computer
clllaaaaaire:
any tips? the quality isn't the best because I am using this site on my computer
 Midnight97:
Kinda a roleplay story between me and my friend enjoy... Part one Forgive me for all the screenshots.
Midnight97:
Kinda a roleplay story between me and my friend enjoy... Part one Forgive me for all the screenshots.
 StevenisGhost:
what type of song should I make next, and will y'all go check out my new song on
Midnight97:
My drawing sure changed over the years look at these two pictures from 2024 to no
StevenisGhost:
what type of song should I make next, and will y'all go check out my new song on
Midnight97:
My drawing sure changed over the years look at these two pictures from 2024 to no
 EdwinJsHispanic:
"poem" love is So Beautiful to have. But it's so hard to have. At this point I don't know whether its worth the wait Or if it's just millions of miles to re
EdwinJsHispanic:
"poem" love is So Beautiful to have. But it's so hard to have. At this point I don't know whether its worth the wait Or if it's just millions of miles to re
EdwinJsHispanic:
"poem" love is So Beautiful to have. But it's so hard to have. At this point I don't know whether its worth the wait Or if it's just millions of miles to re
EdwinJsHispanic:
"poem" love is So Beautiful to have. But it's so hard to have. At this point I don't know whether its worth the wait Or if it's just millions of miles to re