 boredfr:
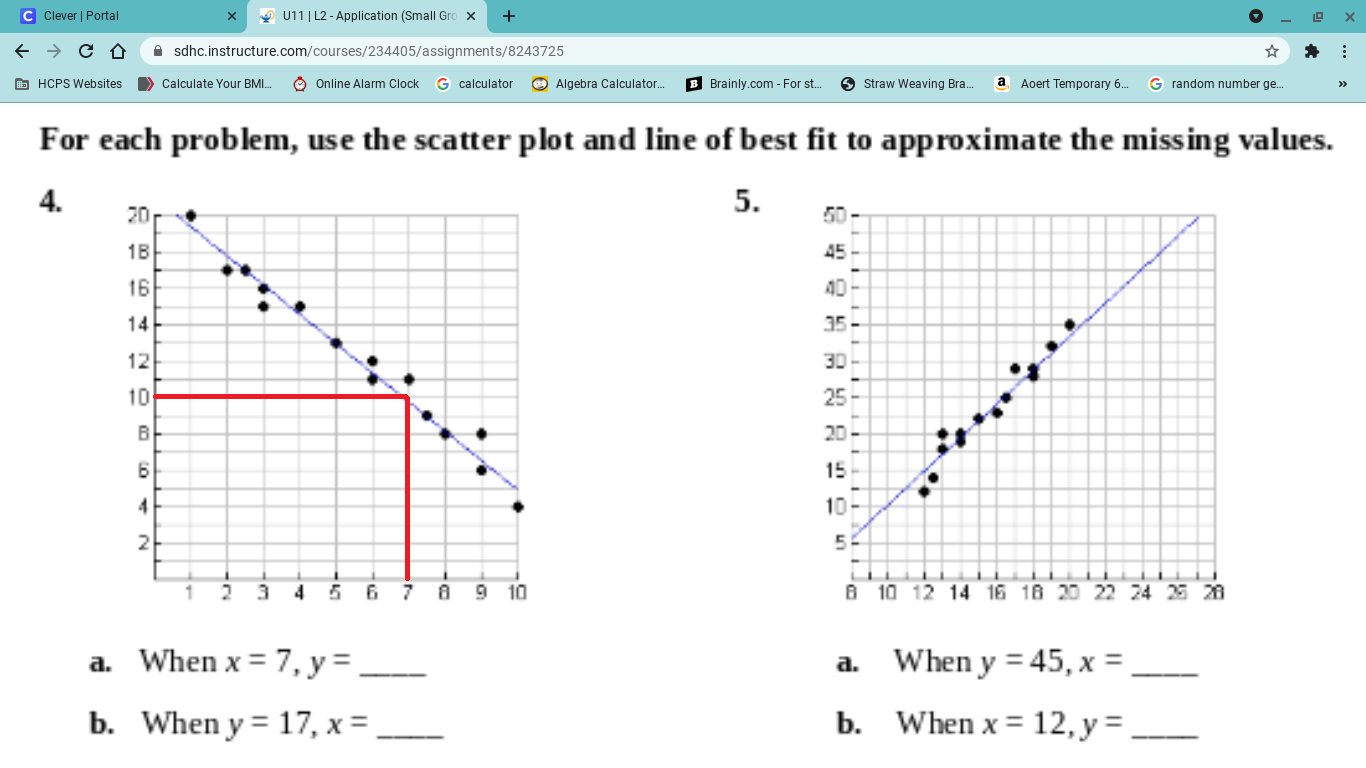
~Snow help meh https://padlet-uploads.storage.googleapis.com/1140267424/211ec5e2274946b2f46eeb20567f07b5/Screenshot_2021_04_19_at_7_17_36_PM.png
 AZ:
AZ:
Same concept for 5a and 5b
boredfr:
I don't understand
AZ:
You literally look at your graph find 7 on the x-axis go up up up until you hit the line and then you go all the way to the left and see what y-value is
boredfr:
Ok
AZ:
And then for the second part, it's just somewhat flipped you find 17 on the y-axis, you keep going to the right until you hit the line and then you go down down down and you see what the x-value is
boredfr:
Ok that I don't understand
AZ:
Okay, one at a time what did you get for the first one?
boredfr:
Part a is 10?
AZ:
Yes!
AZ:
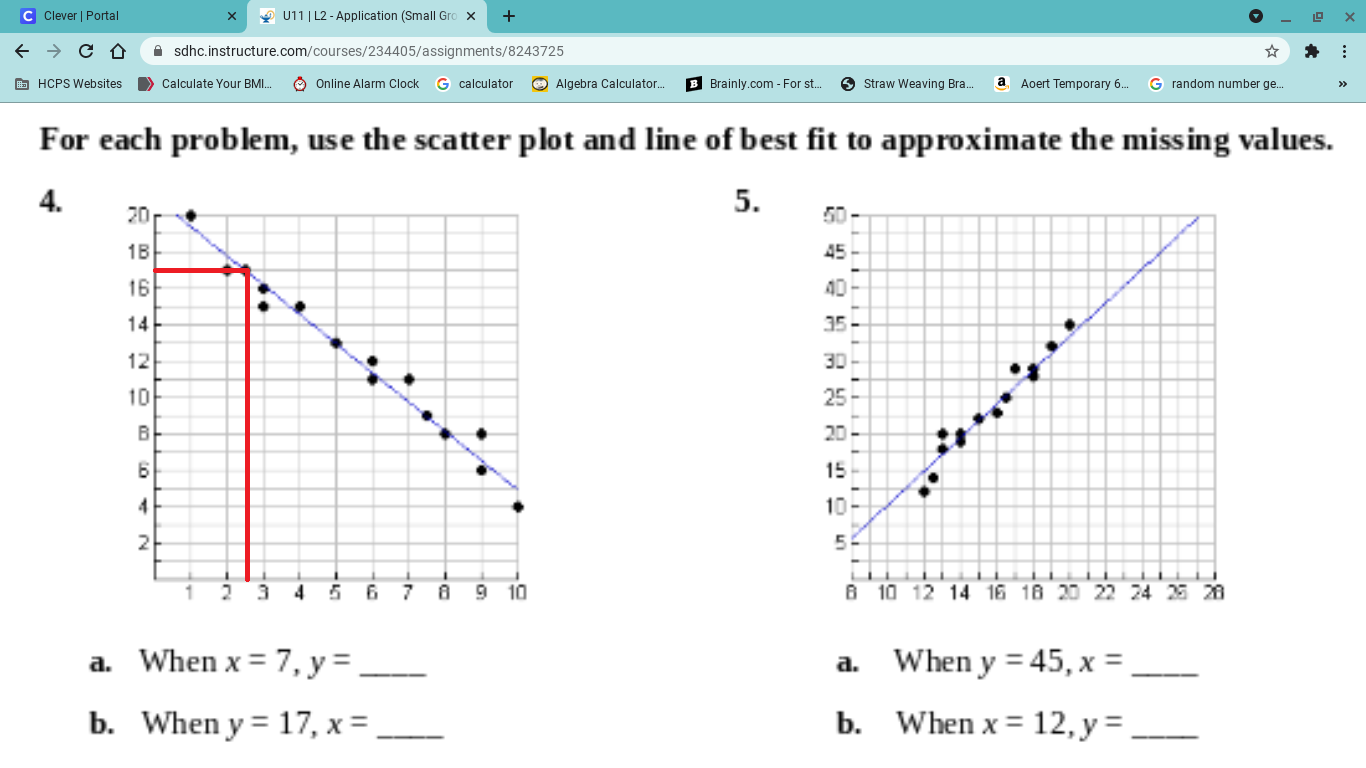
Now the second one says when y = 17, what is the x-value so you have to look at the y-axis and find 17 It's not labelled but it's where I marked it in the image, it's right in the middle of 16 and 18 and then you move to the right until you hit the line and then you have to go down down until you get to the x-axis and you see what number you get
boredfr:
Ok so part b is 2.5?
AZ:
Yup!!
AZ:
Can you do the same for #5?
boredfr:
Part a is 24.5 and part b is 15?
AZ:
Join our real-time social learning platform and learn together with your friends!
 Twaylor:
Time flies doesn't it? I tried to not be the second squeaky wheel of the household and ended up hurting myself and others severely.
Twaylor:
Time flies doesn't it? I tried to not be the second squeaky wheel of the household and ended up hurting myself and others severely.
 clllaaaaaire:
any tips? the quality isn't the best because I am using this site on my computer
clllaaaaaire:
any tips? the quality isn't the best because I am using this site on my computer
 Midnight97:
Kinda a roleplay story between me and my friend enjoy... Part one Forgive me for all the screenshots.
Midnight97:
Kinda a roleplay story between me and my friend enjoy... Part one Forgive me for all the screenshots.
 StevenisGhost:
what type of song should I make next, and will y'all go check out my new song on
Midnight97:
My drawing sure changed over the years look at these two pictures from 2024 to no
StevenisGhost:
what type of song should I make next, and will y'all go check out my new song on
Midnight97:
My drawing sure changed over the years look at these two pictures from 2024 to no
 EdwinJsHispanic:
"poem" love is So Beautiful to have. But it's so hard to have. At this point I don't know whether its worth the wait Or if it's just millions of miles to re
EdwinJsHispanic:
"poem" love is So Beautiful to have. But it's so hard to have. At this point I don't know whether its worth the wait Or if it's just millions of miles to re
EdwinJsHispanic:
"poem" love is So Beautiful to have. But it's so hard to have. At this point I don't know whether its worth the wait Or if it's just millions of miles to re
EdwinJsHispanic:
"poem" love is So Beautiful to have. But it's so hard to have. At this point I don't know whether its worth the wait Or if it's just millions of miles to re
 Breathless:
I don't know if this would be considered art, but its close enough I believe, Any
Breathless:
I don't know if this would be considered art, but its close enough I believe, Any