 boredfr:
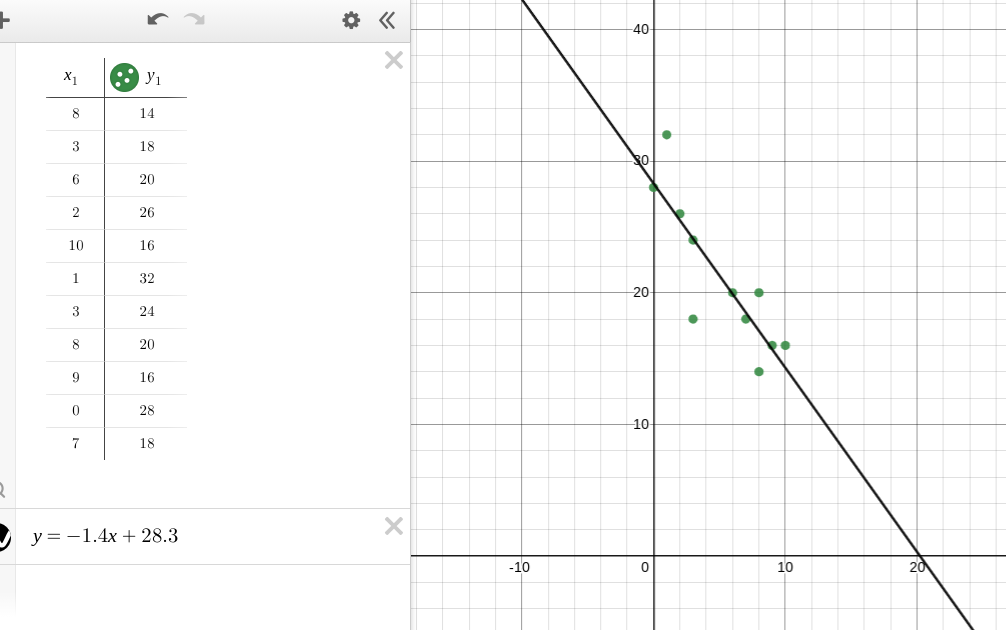
Please check Question: https://padlet-uploads.storage.googleapis.com/1140267424/86c41c8b91f194c76e0849ea0c5c9aec/_6.jpg Part a : https://padlet-uploads.storage.googleapis.com/1140267424/bc1f8af38a0095ff0d2845f452e84e54/Part_a.jpg Part b : Decreasing slope, negative correlation/ association Part C. https://padlet-uploads.storage.googleapis.com/1140267424/89bf653e6687629525fbf219a21381ff/Part_c.jpg !0 hours of television
 snowflake0531:
A and B are right, but I'm not too sure of C I kinda messed with the line and I got
 boredfr:
Ok wait I don't understand .-.
snowflake0531:
A adn B is correct, but I think C is wrong
boredfr:
Ok, what do you think C is then?
snowflake0531:
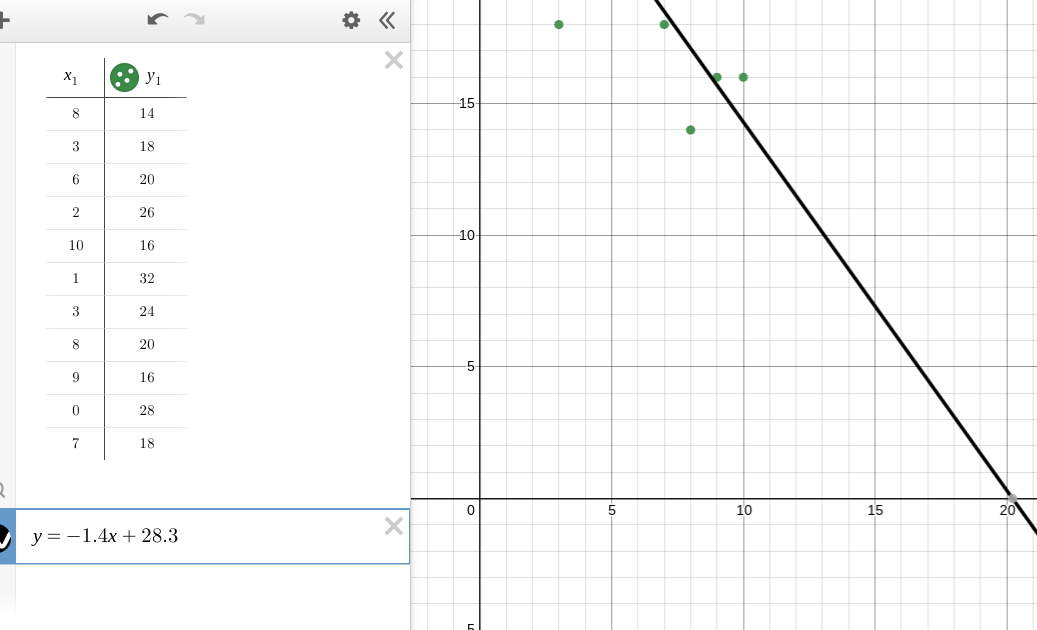
Look at the second screenshot, when x is 18, what is y approximately
snowflake0531:
Also, it's because your graph is a bit inaccurate -> the line of best fit is okay, but because it's with those scalings, it's a bit off
boredfr:
3, but your labeling and mine don't match up-
snowflake0531:
Yes, it's 3 xd
snowflake0531:
and what do you mean?
boredfr:
Ok so when you look at yours it is spaced out with a line for each 1,2,3,4,5, etc. And mine is by 2's starting at 10-
snowflake0531:
That's because I graphed it on desmos, but as long as hte coordinates are how it is, it's fine
snowflake0531:
it's because scaling it like that, it's kinda small and well each spacing isn't really... shown? as clearly
boredfr:
Ok so C is 3?
snowflake0531:
Yes
boredfr:
Oki thx c:
snowflake0531:
yw~
Join our real-time social learning platform and learn together with your friends!
 natalieee:
who else wants a job in biology? I love biomedical science and want to work with
natalieee:
who else wants a job in biology? I love biomedical science and want to work with
 Twaylor:
Time flies doesn't it? I tried to not be the second squeaky wheel of the household and ended up hurting myself and others severely.
Twaylor:
Time flies doesn't it? I tried to not be the second squeaky wheel of the household and ended up hurting myself and others severely.
 clllaaaaaire:
any tips? the quality isn't the best because I am using this site on my computer
clllaaaaaire:
any tips? the quality isn't the best because I am using this site on my computer
 Midnight97:
Kinda a roleplay story between me and my friend enjoy... Part one Forgive me for all the screenshots.
Midnight97:
Kinda a roleplay story between me and my friend enjoy... Part one Forgive me for all the screenshots.
 StevenisGhost:
what type of song should I make next, and will y'all go check out my new song on
Midnight97:
My drawing sure changed over the years look at these two pictures from 2024 to no
StevenisGhost:
what type of song should I make next, and will y'all go check out my new song on
Midnight97:
My drawing sure changed over the years look at these two pictures from 2024 to no
 EdwinJsHispanic:
"poem" love is So Beautiful to have. But it's so hard to have. At this point I don't know whether its worth the wait Or if it's just millions of miles to re
EdwinJsHispanic:
"poem" love is So Beautiful to have. But it's so hard to have. At this point I don't know whether its worth the wait Or if it's just millions of miles to re
EdwinJsHispanic:
"poem" love is So Beautiful to have. But it's so hard to have. At this point I don't know whether its worth the wait Or if it's just millions of miles to re
EdwinJsHispanic:
"poem" love is So Beautiful to have. But it's so hard to have. At this point I don't know whether its worth the wait Or if it's just millions of miles to re