 niahmk:
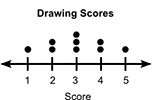
The dot plot below shows the drawing scores of some students: A number line is shown from 1 to 5 in increments of 1. The horizontal axis label is Score. There is 1 dot above 1, 2 dots above 2, 3 dots above 3, 2 dots above 4, and 1 dot above 5. The title of the line plot is Dance Scores. Which statement best describes the shape of the data? It is symmetric and has a peak at 3. It is symmetric and has a peak at 5. It is not symmetric and has a peak at 3. It is not symmetric and has a peak at 5.
 supie:
do you know what symmetrical means ?
niahmk:
exactly similar parts facing each
The term 'symmetric' refers to the fact that it will look the same if the graph is flipped/REVERSED. The 'peak' stands for the highest point when we flip it it will look the same right? and what is the peek of the graph? (where the most dots things are)
supie:
it's when both sides are the same/equal, if i was to cut it in half then it both sides would be the same so take a look at your line plot and tell me if both halves are the same
supie:
@niahmk ? e.e
niahmk:
supie:
1st we're determining if the line plot is symmetrical or not ...
Join our real-time social learning platform and learn together with your friends!
 Strawberryluna:
Read my poem. Im not for criticism its a poem I wrote after my breakup: Youu2019ll never understand the way you made me break, I hate that I still love you
Strawberryluna:
Read my poem. Im not for criticism its a poem I wrote after my breakup: Youu2019ll never understand the way you made me break, I hate that I still love you
 Bounty:
first poem in a min- (tittle)? one moment i'm fine I smile till my face burns I laugh till I cant breath Then I cry I wonder where I went wrong I listen to
Bounty:
first poem in a min- (tittle)? one moment i'm fine I smile till my face burns I laugh till I cant breath Then I cry I wonder where I went wrong I listen to
 Twaylor:
3d printing a glider (for 150 pound 5'8 person - prolly should make it for up to
Twaylor:
3d printing a glider (for 150 pound 5'8 person - prolly should make it for up to
 cullenn:
pitter patter sound of rain gently tapping my window tonight. calming, soothing, right? not for me.
cullenn:
pitter patter sound of rain gently tapping my window tonight. calming, soothing, right? not for me.

 Arriyanalol:
DON'T BUY TICKETS TO SEAWORLD i watched a documentary on seaworld and its sad wha
Arriyanalol:
DON'T BUY TICKETS TO SEAWORLD i watched a documentary on seaworld and its sad wha
 natalieee:
who else wants a job in biology? I love biomedical science and want to work with
Twaylor:
Time flies doesn't it? I tried to not be the second squeaky wheel of the household and ended up hurting myself and others severely.
natalieee:
who else wants a job in biology? I love biomedical science and want to work with
Twaylor:
Time flies doesn't it? I tried to not be the second squeaky wheel of the household and ended up hurting myself and others severely.
 clllaaaaaire:
any tips? the quality isn't the best because I am using this site on my computer
clllaaaaaire:
any tips? the quality isn't the best because I am using this site on my computer