 niahmk:
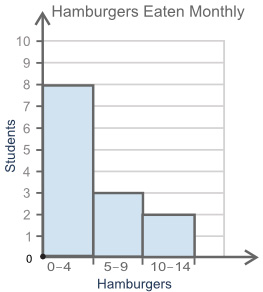
The histogram below shows information about the number of hamburgers students ate in a month: A histogram is titled Hamburgers Eaten Monthly, the horizontal axis is labeled Hamburgers, and the vertical axis is labeled Students. The range on the horizontal axis is 0 to 4, 5 to 9, and 10 to 14. The values on the vertical axis are from 0 to 10 at intervals of 1. The first bin goes to 8, the second bin to 3, the third bin to 2. Which information is provided in the histogram? The mean number of hamburgers eaten The median number of hamburgers eaten The number of students who ate 5 hamburgers or fewer The number of students who ate 10 hamburgers or more
 IhelpUuHELPme:
Based on the histogram, we know that: (Bar 1) 8 students ate 0-4 𝙃𝙖𝙢𝙗𝙪𝙧𝙜𝙚𝙧𝙨 (Bar 2) 3 students ate 5-9 𝙃𝙖𝙢𝙗𝙪𝙧𝙜𝙚𝙧𝙨 (Bar 3) 2 students ate 10-14 𝙃𝙖𝙢𝙗𝙪𝙧𝙜𝙚𝙧𝙨 𝐀𝐧𝐝 𝐰𝐞 𝐬𝐡𝐨𝐮𝐥𝐝 𝐚𝐥𝐬𝐨 𝐧𝐨𝐭𝐢𝐜𝐞 𝐭𝐡𝐚𝐭: 𝐖𝐞 𝐝𝐨𝐧’𝐭 𝐤𝐧𝐨𝐰 𝐡𝐨𝐰 𝐦𝐚𝐧𝐲 𝐬𝐭𝐮𝐝𝐞𝐧𝐭𝐬 𝐚𝐭𝐞 𝐞𝐱𝐚𝐜𝐭𝐥𝐲 𝟓 𝐡𝐚𝐦𝐛𝐮𝐫𝐠𝐞𝐫𝐬. Based on the histogram, and what we have noticed, your answer would be: “The number of students who ate 10 burgers or more.” Correct me if I’m wrong xd
Join our real-time social learning platform and learn together with your friends!
 natalieee:
who else wants a job in biology? I love biomedical science and want to work with
natalieee:
who else wants a job in biology? I love biomedical science and want to work with
 Twaylor:
Time flies doesn't it? I tried to not be the second squeaky wheel of the household and ended up hurting myself and others severely.
Twaylor:
Time flies doesn't it? I tried to not be the second squeaky wheel of the household and ended up hurting myself and others severely.
 clllaaaaaire:
any tips? the quality isn't the best because I am using this site on my computer
clllaaaaaire:
any tips? the quality isn't the best because I am using this site on my computer
 Midnight97:
Kinda a roleplay story between me and my friend enjoy... Part one Forgive me for all the screenshots.
Midnight97:
Kinda a roleplay story between me and my friend enjoy... Part one Forgive me for all the screenshots.
 StevenisGhost:
what type of song should I make next, and will y'all go check out my new song on
Midnight97:
My drawing sure changed over the years look at these two pictures from 2024 to no
StevenisGhost:
what type of song should I make next, and will y'all go check out my new song on
Midnight97:
My drawing sure changed over the years look at these two pictures from 2024 to no
 EdwinJsHispanic:
"poem" love is So Beautiful to have. But it's so hard to have. At this point I don't know whether its worth the wait Or if it's just millions of miles to re
EdwinJsHispanic:
"poem" love is So Beautiful to have. But it's so hard to have. At this point I don't know whether its worth the wait Or if it's just millions of miles to re
EdwinJsHispanic:
"poem" love is So Beautiful to have. But it's so hard to have. At this point I don't know whether its worth the wait Or if it's just millions of miles to re
EdwinJsHispanic:
"poem" love is So Beautiful to have. But it's so hard to have. At this point I don't know whether its worth the wait Or if it's just millions of miles to re