 niahmk:
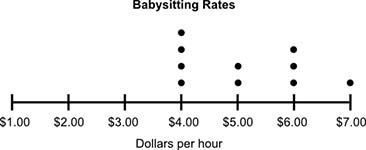
The dot plot below shows the hourly rate of some babysitters in a city: A number line is shown from 1 dollar to 7 dollars in increments of 1 dollar for each tick mark. The horizontal axis label is Dollar per hour. There are 4 dots above 4 dollars, 2 dots above 5 dollars, 3 dots above 6 dollars, and 1 dot above 7 dollars. The title of the line plot is Babysitting Rates. Which statement best describes the shape of the data? It is a cluster from $1.00 to $7.00 and has no gaps. It is a cluster from $1.00 to $7.00 and has gaps. It is not symmetric and has a peak at $4.00. It is symmetric and has a peak at $7.00.
 SmokeyBrown:
We can see that the $4 mark has the most points, so that would be the peak. The data is also not the same on the right and left side, so it is not symmetric. That means that the third answer choice would fit; is it the best choice? The fourth choice is just not true; we know that the peak is at $4, not $7. The first and second choices also can't be right, since the cluster of data does not extend from $1 to $7; all of the data points appear from $4 to $7.
niahmk:
SmokeyBrown:
I think so, yes
Join our real-time social learning platform and learn together with your friends!
 Twaylor:
Time flies doesn't it? I tried to not be the second squeaky wheel of the household and ended up hurting myself and others severely.
Twaylor:
Time flies doesn't it? I tried to not be the second squeaky wheel of the household and ended up hurting myself and others severely.
 clllaaaaaire:
any tips? the quality isn't the best because I am using this site on my computer
clllaaaaaire:
any tips? the quality isn't the best because I am using this site on my computer
 Midnight97:
Kinda a roleplay story between me and my friend enjoy... Part one Forgive me for all the screenshots.
Midnight97:
Kinda a roleplay story between me and my friend enjoy... Part one Forgive me for all the screenshots.
 StevenisGhost:
what type of song should I make next, and will y'all go check out my new song on
Midnight97:
My drawing sure changed over the years look at these two pictures from 2024 to no
StevenisGhost:
what type of song should I make next, and will y'all go check out my new song on
Midnight97:
My drawing sure changed over the years look at these two pictures from 2024 to no
 EdwinJsHispanic:
"poem" love is So Beautiful to have. But it's so hard to have. At this point I don't know whether its worth the wait Or if it's just millions of miles to re
EdwinJsHispanic:
"poem" love is So Beautiful to have. But it's so hard to have. At this point I don't know whether its worth the wait Or if it's just millions of miles to re
EdwinJsHispanic:
"poem" love is So Beautiful to have. But it's so hard to have. At this point I don't know whether its worth the wait Or if it's just millions of miles to re
EdwinJsHispanic:
"poem" love is So Beautiful to have. But it's so hard to have. At this point I don't know whether its worth the wait Or if it's just millions of miles to re
 Breathless:
I don't know if this would be considered art, but its close enough I believe, Any
Breathless:
I don't know if this would be considered art, but its close enough I believe, Any