 noobpro78:
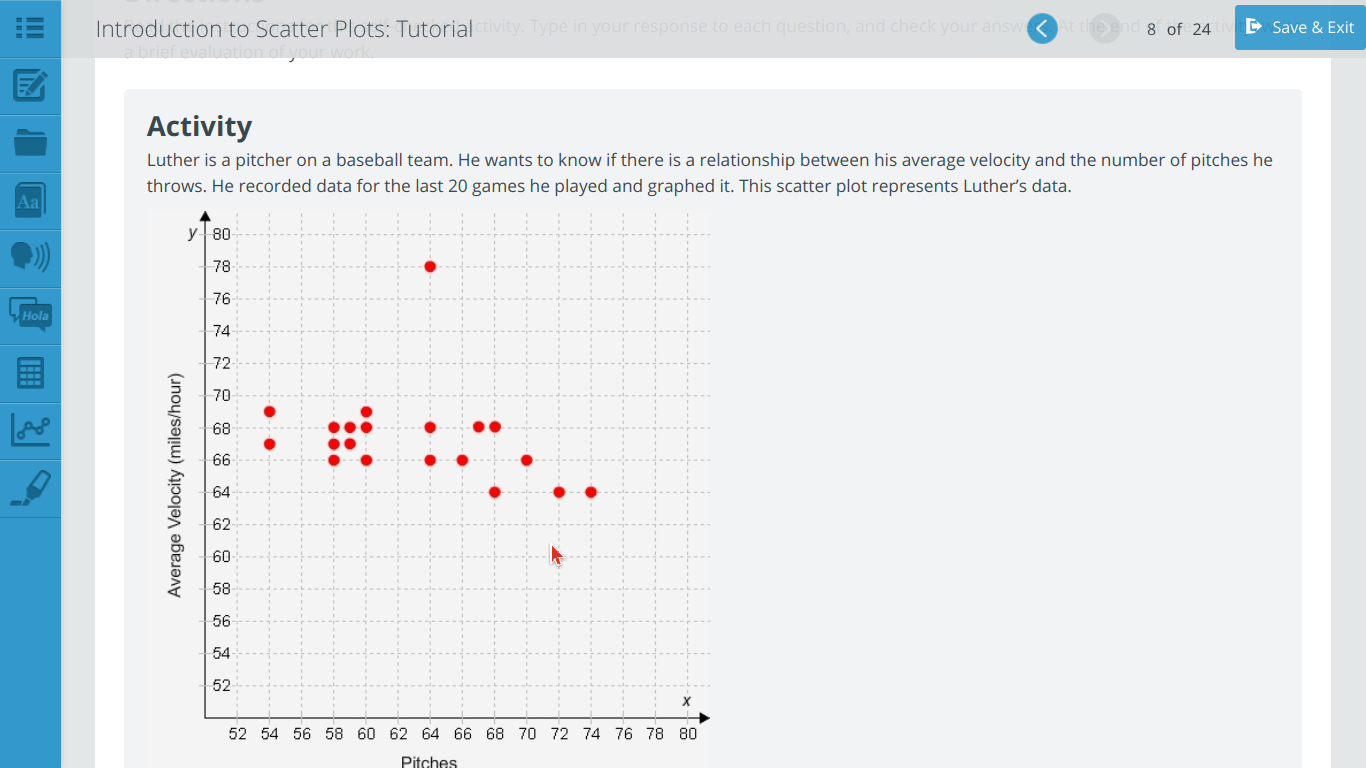
Outliers and Clusters This activity will help you meet these educational goals: Mathematical Practices—You will make sense of problems and solve them, reason abstractly and quantitatively, use mathematics to model real-world situations, attend to precision, and look for and make use of structure. Directions Read the instructions for this self-checked activity. Type in your response to each question, and check your answers. At the end of the activity, write a brief evaluation of your work. Activity Luther is a pitcher on a baseball team. He wants to know if there is a relationship between his average velocity and the number of pitches he throws. He recorded data for the last 20 games he played and graphed it. This scatter plot represents Luther’s data.

 Extrinix:
Ok so, on the first question it wants you to find the x range that the points are in, and the x value goes \(\leftarrow x \rightarrow\) . So you fin the farthest point to the left and locate it's x value, then find the farthest right point and figure out it's x value.
noobpro78:
thx
noobpro78:
im going to add the next question on here
Extrinix:
for the second one, find the highest point and the lowest point, then find their y value.
noobpro78:
Question 2 Part A Do any outliers appear to be in the data?
Extrinix:
(y goes) \(\uparrow\) \(y\) \(\downarrow\)
noobpro78:
Part B If there are any outliers, how many are there and what are their x- and y-values?
Extrinix:
noobpro78:
i have a couple more question bit they might have diffrent cahrts
Extrinix:
Ok
noobpro78:
im going to make a diffrent question
Join our real-time social learning platform and learn together with your friends!
 natalieee:
who else wants a job in biology? I love biomedical science and want to work with
natalieee:
who else wants a job in biology? I love biomedical science and want to work with
 Twaylor:
Time flies doesn't it? I tried to not be the second squeaky wheel of the household and ended up hurting myself and others severely.
Twaylor:
Time flies doesn't it? I tried to not be the second squeaky wheel of the household and ended up hurting myself and others severely.
 clllaaaaaire:
any tips? the quality isn't the best because I am using this site on my computer
clllaaaaaire:
any tips? the quality isn't the best because I am using this site on my computer
 Midnight97:
Kinda a roleplay story between me and my friend enjoy... Part one Forgive me for all the screenshots.
Midnight97:
Kinda a roleplay story between me and my friend enjoy... Part one Forgive me for all the screenshots.
 StevenisGhost:
what type of song should I make next, and will y'all go check out my new song on
Midnight97:
My drawing sure changed over the years look at these two pictures from 2024 to no
StevenisGhost:
what type of song should I make next, and will y'all go check out my new song on
Midnight97:
My drawing sure changed over the years look at these two pictures from 2024 to no
 EdwinJsHispanic:
"poem" love is So Beautiful to have. But it's so hard to have. At this point I don't know whether its worth the wait Or if it's just millions of miles to re
EdwinJsHispanic:
"poem" love is So Beautiful to have. But it's so hard to have. At this point I don't know whether its worth the wait Or if it's just millions of miles to re
EdwinJsHispanic:
"poem" love is So Beautiful to have. But it's so hard to have. At this point I don't know whether its worth the wait Or if it's just millions of miles to re
EdwinJsHispanic:
"poem" love is So Beautiful to have. But it's so hard to have. At this point I don't know whether its worth the wait Or if it's just millions of miles to re