 ChrisTheFlash:
i have some questions
 Rival:
What? is it
 Katrin369:
Rival:
ight
Rival:
idk this yet srry
ChrisTheFlash:
do u know the answer?
ChrisTheFlash:
what is the answer
ChrisTheFlash:
bruh its multiple choice all i need is an answer.
Katrin369:
It's a multi choice answer right?
Katrin369:
Well there is only one answer.
ChrisTheFlash:
what is it?
Katrin369:
ChrisTheFlash:
yes
Katrin369:
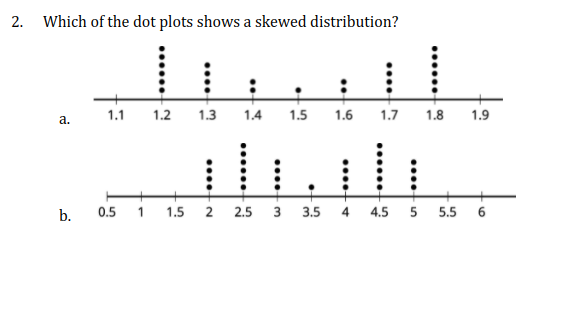
Hint: A distribution is skewed if one of its tails is longer than the other.
ChrisTheFlash:
im just gonna guess
Katrin369:
So,
Katrin369:
Okay, what do you think?
ChrisTheFlash:
i think it is b
Katrin369:
Katrin369:
And so is C.
Katrin369:
And so is A.
Katrin369:
So you're left with D.
ChrisTheFlash:
wait i thought about it i think it is a or c
ChrisTheFlash:
what about this problem
Katrin369:
A and C are symmetrical. A skewed distribution is not symmetrical.
Katrin369:
 memeXpapi:
?
Katrin369:
Okay,
Katrin369:
Lets eliminate 2 options.
ChrisTheFlash:
a and c
Katrin369:
Okay correct
Katrin369:
Why are you eliminating them?
ChrisTheFlash:
umm i just feel like i should
Katrin369:
Katrin369:
Okay Then I will
Katrin369:
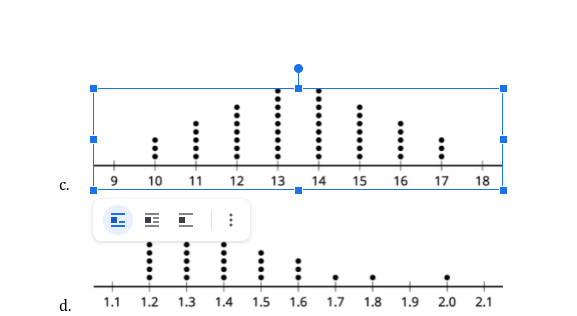
Can you tell me what is symmetric distribution?
ChrisTheFlash:
ummm i think In statistics, a symmetric probability distribution is a probability distribution and assignment of probabilities to possible occurrences—which is unchanged when its probability density function
Katrin369:
Katrin369:
Now, what do you think the answer is?
ChrisTheFlash:
still no
ChrisTheFlash:
wait
ChrisTheFlash:
its b
Katrin369:
Katrin369:
Can you tell my why you eliminated A and C?
 Katrin369:
Are there graphs to this question?
ChrisTheFlash:
no
Katrin369:
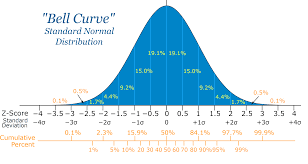
Okay. Can you explain what is "bell curve"?
ChrisTheFlash:
a bell with curves :D
Katrin369:
ChrisTheFlash:
A bell curve is a graph depicting the normal distribution, which has a shape reminiscent of a bell. ... Its standard deviation depicts the bell curve's relative width around the mean. Bell curves (normal distributions) are used commonly in statistics, including in analyzing economic and financial data.
Katrin369:
Katrin369:
 Katrin369:
Okay.
Katrin369:
Okay there has to be a plot graph read the question.
 Katrin369:
This is a different question.
Katrin369:
Okay lets solve this question.
ChrisTheFlash:
can we hurry i have a meeting in 15 minues
 Katrin369:
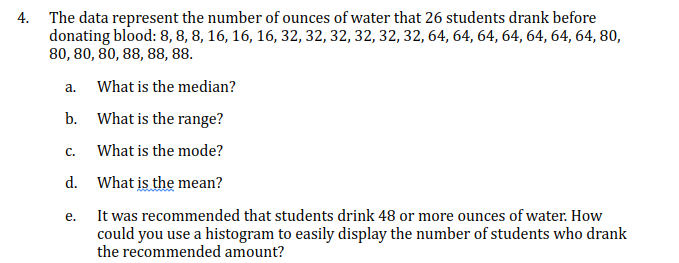
First, find out how do you find the median. Next, find out how do you find the range. Then, find out how do you find the mode. Finally, find out how do you find the mean. Then, we will solve E.
Katrin369:
Let me know if you need help with A-D.
ChrisTheFlash:
just tell me wht e is
Katrin369:
Join our real-time social learning platform and learn together with your friends!
 Twaylor:
Time flies doesn't it? I tried to not be the second squeaky wheel of the household and ended up hurting myself and others severely.
Twaylor:
Time flies doesn't it? I tried to not be the second squeaky wheel of the household and ended up hurting myself and others severely.
 clllaaaaaire:
any tips? the quality isn't the best because I am using this site on my computer
clllaaaaaire:
any tips? the quality isn't the best because I am using this site on my computer
 Midnight97:
Kinda a roleplay story between me and my friend enjoy... Part one Forgive me for all the screenshots.
Midnight97:
Kinda a roleplay story between me and my friend enjoy... Part one Forgive me for all the screenshots.
 StevenisGhost:
what type of song should I make next, and will y'all go check out my new song on
Midnight97:
My drawing sure changed over the years look at these two pictures from 2024 to no
StevenisGhost:
what type of song should I make next, and will y'all go check out my new song on
Midnight97:
My drawing sure changed over the years look at these two pictures from 2024 to no
 EdwinJsHispanic:
"poem" love is So Beautiful to have. But it's so hard to have. At this point I don't know whether its worth the wait Or if it's just millions of miles to re
EdwinJsHispanic:
"poem" love is So Beautiful to have. But it's so hard to have. At this point I don't know whether its worth the wait Or if it's just millions of miles to re
EdwinJsHispanic:
"poem" love is So Beautiful to have. But it's so hard to have. At this point I don't know whether its worth the wait Or if it's just millions of miles to re
EdwinJsHispanic:
"poem" love is So Beautiful to have. But it's so hard to have. At this point I don't know whether its worth the wait Or if it's just millions of miles to re
 Breathless:
I don't know if this would be considered art, but its close enough I believe, Any
Breathless:
I don't know if this would be considered art, but its close enough I believe, Any