 noobpro78:
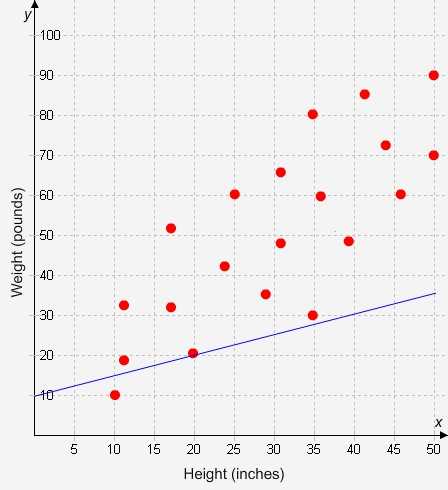
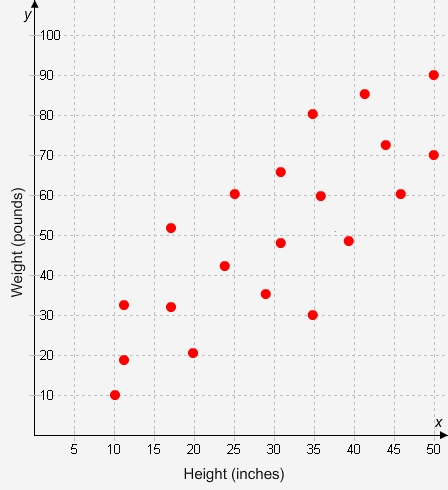
Lines of Best Fit This activity will help you meet these educational goals: Mathematical Practices—You will reason abstractly and quantitatively, construct viable arguments and analyze the reasoning of others, use mathematics to model real-world situations, attend to precision, and look for and make use of structure. Directions Read the instructions for this self-checked activity. Type in your response to each question, and check your answers. At the end of the activity, write a brief evaluation of your work. Activity Steven wants to know if an equation can model a dog’s weight in terms of its height. So he collects the heights and weights of 20 dogs. Steven then plots the data on this scatter plot. In this activity, you will determine whether the given lines are the line of best fit for the following scatter plot. Part A Does this line fit the data? Explain your answer.
 noobpro78:
these are the same just a little diffrent
 Aphmau:
What kind of math is this I mean I am just wondering bc I am confused
noobpro78:
um let me see Scatter Plots with Linear Associations:
Aphmau:
Hmm idk this is kinda hard for me
noobpro78:
oh ok
 snowflake0531:
Well, these kind of problems... it's just more of a what do you think, Line of best fit is like... you see you have a scatterplot, what linear equation/graph can you write/draw... that makes the smallest standard deviation, and makes the line go cleanly through all of the scatter points
snowflake0531:
So for the first screenshot, do you think that the line is the line of best fit for that scatter plot? Do you think that it fits the points
Join our real-time social learning platform and learn together with your friends!
 natalieee:
who else wants a job in biology? I love biomedical science and want to work with
natalieee:
who else wants a job in biology? I love biomedical science and want to work with
 Twaylor:
Time flies doesn't it? I tried to not be the second squeaky wheel of the household and ended up hurting myself and others severely.
Twaylor:
Time flies doesn't it? I tried to not be the second squeaky wheel of the household and ended up hurting myself and others severely.
 clllaaaaaire:
any tips? the quality isn't the best because I am using this site on my computer
clllaaaaaire:
any tips? the quality isn't the best because I am using this site on my computer
 Midnight97:
Kinda a roleplay story between me and my friend enjoy... Part one Forgive me for all the screenshots.
Midnight97:
Kinda a roleplay story between me and my friend enjoy... Part one Forgive me for all the screenshots.
 StevenisGhost:
what type of song should I make next, and will y'all go check out my new song on
Midnight97:
My drawing sure changed over the years look at these two pictures from 2024 to no
StevenisGhost:
what type of song should I make next, and will y'all go check out my new song on
Midnight97:
My drawing sure changed over the years look at these two pictures from 2024 to no
 EdwinJsHispanic:
"poem" love is So Beautiful to have. But it's so hard to have. At this point I don't know whether its worth the wait Or if it's just millions of miles to re
EdwinJsHispanic:
"poem" love is So Beautiful to have. But it's so hard to have. At this point I don't know whether its worth the wait Or if it's just millions of miles to re
EdwinJsHispanic:
"poem" love is So Beautiful to have. But it's so hard to have. At this point I don't know whether its worth the wait Or if it's just millions of miles to re
EdwinJsHispanic:
"poem" love is So Beautiful to have. But it's so hard to have. At this point I don't know whether its worth the wait Or if it's just millions of miles to re