 Gucchi:
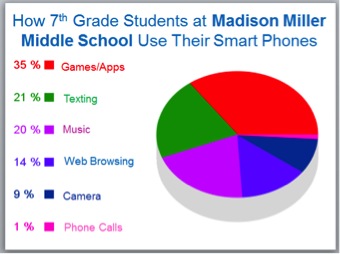
The following question refers to the text and graphic below. Read the text and view the graphic carefully to help you choose the best response. "How 7th Grade Students at Madison Middle School Use Their Smart Phones" I recently surveyed seventh graders at Madison Middle School to determine how they used their cell phones. My goal was to determine which daily activities were the most popular. Out of 151 seventh graders in our school, 93 of them use smart phones. 57 of those students agreed to track their cell phones usage in a journal for three days. I compared journal statistics and gathered the following data. Data revealed that students spent 35 percent of their phone time playing games and using apps. These included games played alone and against friends. It also includes social media apps. Students spend 21 percent of their time texting and 20 percent of their time listening to music. Music included songs downloaded on their phones and music that streamed from other sources.14 percent of cell phone time was spent browsing the Internet while 9 percent of the time was spent using the phone to take photographs. Most ironically, students reported spending only 1 percent of their time using cell phones to make actual phone calls. The text and the graphic reflect the same student survey. Which information is found in both the text and the graphic? Data representing the types of apps, games, and music that students used Data representing the name of the middle school and grade level of the participants An explanation of how the survey was conducted and the data was gathered An explanation about the total number of students who participated in the survey
 Gucchi:
Am i right with B?
 MrMudd183:
Yep, i'll explain
MrMudd183:
There is no explanation on the total of students surveyed within the pie chart, so that gets rid of D
Gucchi:
Okay.
MrMudd183:
We can also get rid of A because it doesn't state the type of games and/or apps that the students used. So that leaves us with B and C
Gucchi:
Okay
MrMudd183:
And we can get rid of C because the pie chart doesn't say how the data was collected, so that just leaves us with B as the answer choice
Gucchi:
Thanks for the explanations!
MrMudd183:
You're welcome C-:
Gucchi:
This was my last question for the day btw
MrMudd183:
Oh cool, if you need any more to review just to be sure feel free to tag me
Gucchi:
Okay! :)
Join our real-time social learning platform and learn together with your friends!
 Twaylor:
Time flies doesn't it? I tried to not be the second squeaky wheel of the household and ended up hurting myself and others severely.
Twaylor:
Time flies doesn't it? I tried to not be the second squeaky wheel of the household and ended up hurting myself and others severely.
 clllaaaaaire:
any tips? the quality isn't the best because I am using this site on my computer
clllaaaaaire:
any tips? the quality isn't the best because I am using this site on my computer
 Midnight97:
Kinda a roleplay story between me and my friend enjoy... Part one Forgive me for all the screenshots.
Midnight97:
Kinda a roleplay story between me and my friend enjoy... Part one Forgive me for all the screenshots.
 StevenisGhost:
what type of song should I make next, and will y'all go check out my new song on
Midnight97:
My drawing sure changed over the years look at these two pictures from 2024 to no
StevenisGhost:
what type of song should I make next, and will y'all go check out my new song on
Midnight97:
My drawing sure changed over the years look at these two pictures from 2024 to no
 EdwinJsHispanic:
"poem" love is So Beautiful to have. But it's so hard to have. At this point I don't know whether its worth the wait Or if it's just millions of miles to re
EdwinJsHispanic:
"poem" love is So Beautiful to have. But it's so hard to have. At this point I don't know whether its worth the wait Or if it's just millions of miles to re
EdwinJsHispanic:
"poem" love is So Beautiful to have. But it's so hard to have. At this point I don't know whether its worth the wait Or if it's just millions of miles to re
EdwinJsHispanic:
"poem" love is So Beautiful to have. But it's so hard to have. At this point I don't know whether its worth the wait Or if it's just millions of miles to re
 Breathless:
I don't know if this would be considered art, but its close enough I believe, Any
Breathless:
I don't know if this would be considered art, but its close enough I believe, Any