 niahmk:
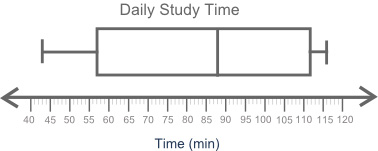
The box plot shows the total amount of time, in minutes, the students of a class spend studying each day: A box plot is titled Daily Study Time and labeled Time (min). The left most point on the number line is 40 and the right most point is 120. The box is labeled 57 on the left edge and 112 on the right edge. A vertical line is drawn inside the rectangle at the point 88. The whiskers are labeled as 43 and 116. What information is provided by the box plot? The lower quartile for the data The number of students who provided information The mean for the data The number of students who studied for more than 112.5 minutes
 NoLuvRoss:
Box plots give the five number summary of the data set. The whiskers indicate the minimum daily travel time, which is 11 minutes, and the maximum daily travel time, which is 45 minutes. These values are not outliers because they are connected to the box with whiskers. Meanwhile, the box indicates that the first quartile of the data set is 16, the median is 28, and the third quartile is 36. its A i believe
Join our real-time social learning platform and learn together with your friends!
 Strawberryluna:
Read my poem. Im not for criticism its a poem I wrote after my breakup: Youu2019ll never understand the way you made me break, I hate that I still love you
Strawberryluna:
Read my poem. Im not for criticism its a poem I wrote after my breakup: Youu2019ll never understand the way you made me break, I hate that I still love you
 Bounty:
first poem in a min- (tittle)? one moment i'm fine I smile till my face burns I laugh till I cant breath Then I cry I wonder where I went wrong I listen to
Bounty:
first poem in a min- (tittle)? one moment i'm fine I smile till my face burns I laugh till I cant breath Then I cry I wonder where I went wrong I listen to
 Twaylor:
3d printing a glider (for 150 pound 5'8 person - prolly should make it for up to
Twaylor:
3d printing a glider (for 150 pound 5'8 person - prolly should make it for up to
 cullenn:
pitter patter sound of rain gently tapping my window tonight. calming, soothing, right? not for me.
cullenn:
pitter patter sound of rain gently tapping my window tonight. calming, soothing, right? not for me.

 Arriyanalol:
DON'T BUY TICKETS TO SEAWORLD i watched a documentary on seaworld and its sad wha
Arriyanalol:
DON'T BUY TICKETS TO SEAWORLD i watched a documentary on seaworld and its sad wha
 natalieee:
who else wants a job in biology? I love biomedical science and want to work with
Twaylor:
Time flies doesn't it? I tried to not be the second squeaky wheel of the household and ended up hurting myself and others severely.
natalieee:
who else wants a job in biology? I love biomedical science and want to work with
Twaylor:
Time flies doesn't it? I tried to not be the second squeaky wheel of the household and ended up hurting myself and others severely.
 clllaaaaaire:
any tips? the quality isn't the best because I am using this site on my computer
clllaaaaaire:
any tips? the quality isn't the best because I am using this site on my computer