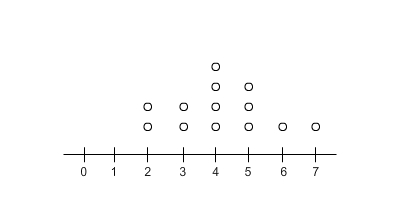
The dot plot represents the scores of a group of students on an English test. If the dot plot is converted to a box plot, the first quartile would be drawn at , and the median would be drawn at
i do not remember how to do these
some of it
its likely something simple im not remembering though tbh
 new2luv:
@snowflake0531
 snowflake0531:
Can you first list all the numbers in increasing order? the middle number is the median and then take out hte median and all higher numbers, keep the lower half the median of the lower half is quartile 1
ohh, ok that makes sense
6,7,2,3,5,4 is increasing number, ig middle would be 2.5?
yes
snowflake0531:
no, that's not increasing order..
no its icreasing order
let me fix it
snowflake0531:
2, 2, 3, 3, 4, 4, 4, 4, 5, 5, 5, 6, 7
snowflake0531:
now what's the middle number
|dw:1622054194728:dw|
oh like that ok, 4 would be
snowflake0531:
yeah
im smart
so median is fou, first quartile is drawn at 2?
four*
=i mess up
ok
you seen
snowflake0531:
The median is 4 2, 2, 3, 3, 4, 4, 4, 4, 5, 5, 5, 6, 7 so then you have 2, 2, 3, 3, 4, 4 what's the middle?
3 is
yes
me and snowflake make a good team
Join our real-time social learning platform and learn together with your friends!
 Twaylor:
Time flies doesn't it? I tried to not be the second squeaky wheel of the household and ended up hurting myself and others severely.
Twaylor:
Time flies doesn't it? I tried to not be the second squeaky wheel of the household and ended up hurting myself and others severely.
 clllaaaaaire:
any tips? the quality isn't the best because I am using this site on my computer
clllaaaaaire:
any tips? the quality isn't the best because I am using this site on my computer
 Midnight97:
Kinda a roleplay story between me and my friend enjoy... Part one Forgive me for all the screenshots.
Midnight97:
Kinda a roleplay story between me and my friend enjoy... Part one Forgive me for all the screenshots.
 StevenisGhost:
what type of song should I make next, and will y'all go check out my new song on
Midnight97:
My drawing sure changed over the years look at these two pictures from 2024 to no
StevenisGhost:
what type of song should I make next, and will y'all go check out my new song on
Midnight97:
My drawing sure changed over the years look at these two pictures from 2024 to no
 EdwinJsHispanic:
"poem" love is So Beautiful to have. But it's so hard to have. At this point I don't know whether its worth the wait Or if it's just millions of miles to re
EdwinJsHispanic:
"poem" love is So Beautiful to have. But it's so hard to have. At this point I don't know whether its worth the wait Or if it's just millions of miles to re
EdwinJsHispanic:
"poem" love is So Beautiful to have. But it's so hard to have. At this point I don't know whether its worth the wait Or if it's just millions of miles to re
EdwinJsHispanic:
"poem" love is So Beautiful to have. But it's so hard to have. At this point I don't know whether its worth the wait Or if it's just millions of miles to re
 Breathless:
I don't know if this would be considered art, but its close enough I believe, Any
Breathless:
I don't know if this would be considered art, but its close enough I believe, Any