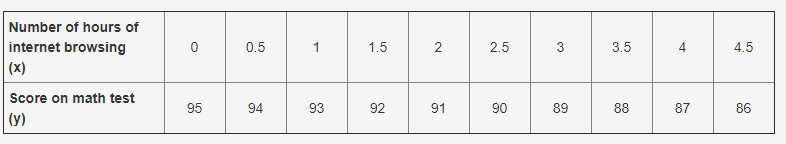
A student is assessing the correlation between the average number of hours of internet browsing and average score on a math test. The table below shows the data: Number of hours of internet browsing (x) 0 0.5 1 1.5 2 2.5 3 3.5 4 4.5 Score on math test (y) 95 94 93 92 91 90 89 88 87 86 Part A: Is there any correlation between the average number of hours of internet browsing and average score on the math test? Justify your answer. (4 points) Part B: Write a function which best fits the data. (3 points) Part C: What does the slope and y-intercept of the plot indicate? (3 points)
 SmokeyBrown:
Looking at the numbers, it does seem like there is a correlation between hours of internet and the test scores. Every extra half-hour actually seems correlated to one less point on the test score. The function would want to take into account how the test score starts, with 0 hours of internet browsing, and also represent how that changes with every additional hour spent. So, at 0 hours, the test score average is 95, but with every additional hour, that score goes down by 2. And this is related to the equation from part B: the slope would represent the change in test score with each additional hour of internet browsing, and the y-intercept would represent the average score with 0 hours of internet browsing
Join our real-time social learning platform and learn together with your friends!
 natalieee:
who else wants a job in biology? I love biomedical science and want to work with
natalieee:
who else wants a job in biology? I love biomedical science and want to work with
 Twaylor:
Time flies doesn't it? I tried to not be the second squeaky wheel of the household and ended up hurting myself and others severely.
Twaylor:
Time flies doesn't it? I tried to not be the second squeaky wheel of the household and ended up hurting myself and others severely.
 clllaaaaaire:
any tips? the quality isn't the best because I am using this site on my computer
clllaaaaaire:
any tips? the quality isn't the best because I am using this site on my computer
 Midnight97:
Kinda a roleplay story between me and my friend enjoy... Part one Forgive me for all the screenshots.
Midnight97:
Kinda a roleplay story between me and my friend enjoy... Part one Forgive me for all the screenshots.
 StevenisGhost:
what type of song should I make next, and will y'all go check out my new song on
Midnight97:
My drawing sure changed over the years look at these two pictures from 2024 to no
StevenisGhost:
what type of song should I make next, and will y'all go check out my new song on
Midnight97:
My drawing sure changed over the years look at these two pictures from 2024 to no
 EdwinJsHispanic:
"poem" love is So Beautiful to have. But it's so hard to have. At this point I don't know whether its worth the wait Or if it's just millions of miles to re
EdwinJsHispanic:
"poem" love is So Beautiful to have. But it's so hard to have. At this point I don't know whether its worth the wait Or if it's just millions of miles to re
EdwinJsHispanic:
"poem" love is So Beautiful to have. But it's so hard to have. At this point I don't know whether its worth the wait Or if it's just millions of miles to re
EdwinJsHispanic:
"poem" love is So Beautiful to have. But it's so hard to have. At this point I don't know whether its worth the wait Or if it's just millions of miles to re