 TaitlynCroft:
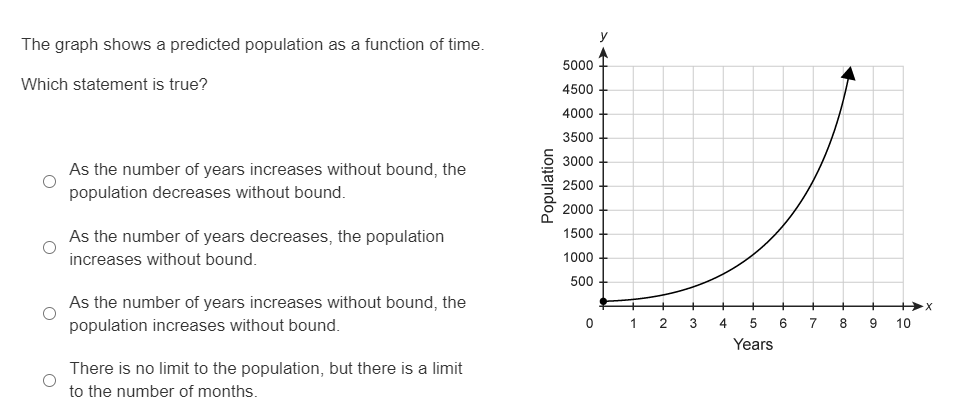
The graph shows a predicted population as a function of time. Which statement is true?
TaitlynCroft:
HELP ME
 MusicGeek:
do u have a ss of the problem?
TaitlynCroft:
Ok, I literally joined this site minutes ago. I don't know how this all work and the f is ss standin for?
MusicGeek:
Screenshot
TaitlynCroft:
Oh. Sorry I'm stupid lemme do that now.
 carmelle:
ok so first, is the line increasing or decreasing?
TaitlynCroft:
increasing
carmelle:
ok, so which choice can we eliminate right off the bat?
TaitlynCroft:
The first one the population does not decrease
TaitlynCroft:
Nor do the years
TaitlynCroft:
Oh I know it. I see it now.
carmelle:
thats correct, what other choices can you eliminate??
TaitlynCroft:
I got the answer: As the number of years increases without bound, the population increases without bound.
carmelle:
Yes!! That would be correct! Looking at the graph, we can see both the years and population are increasing. Great job :D
TaitlynCroft:
Thanks. PS became a fan and also added this sight as a bookmark. Best homework help EVER
carmelle:
That you!! and I'm glad you like this site!! Welcome to qc and enjoy your stay~
Join our real-time social learning platform and learn together with your friends!
 natalieee:
who else wants a job in biology? I love biomedical science and want to work with
natalieee:
who else wants a job in biology? I love biomedical science and want to work with
 Twaylor:
Time flies doesn't it? I tried to not be the second squeaky wheel of the household and ended up hurting myself and others severely.
Twaylor:
Time flies doesn't it? I tried to not be the second squeaky wheel of the household and ended up hurting myself and others severely.
 clllaaaaaire:
any tips? the quality isn't the best because I am using this site on my computer
clllaaaaaire:
any tips? the quality isn't the best because I am using this site on my computer
 Midnight97:
Kinda a roleplay story between me and my friend enjoy... Part one Forgive me for all the screenshots.
Midnight97:
Kinda a roleplay story between me and my friend enjoy... Part one Forgive me for all the screenshots.
 StevenisGhost:
what type of song should I make next, and will y'all go check out my new song on
Midnight97:
My drawing sure changed over the years look at these two pictures from 2024 to no
StevenisGhost:
what type of song should I make next, and will y'all go check out my new song on
Midnight97:
My drawing sure changed over the years look at these two pictures from 2024 to no
 EdwinJsHispanic:
"poem" love is So Beautiful to have. But it's so hard to have. At this point I don't know whether its worth the wait Or if it's just millions of miles to re
EdwinJsHispanic:
"poem" love is So Beautiful to have. But it's so hard to have. At this point I don't know whether its worth the wait Or if it's just millions of miles to re
EdwinJsHispanic:
"poem" love is So Beautiful to have. But it's so hard to have. At this point I don't know whether its worth the wait Or if it's just millions of miles to re
EdwinJsHispanic:
"poem" love is So Beautiful to have. But it's so hard to have. At this point I don't know whether its worth the wait Or if it's just millions of miles to re