 yomomalikebracobama:
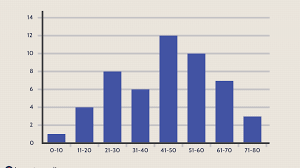
Which of the following types of graphs is best for seeing a Pizzaulative pattern in the data? (2 points) a Histogram b Ogive c Scatter plot d Stem-and-leaf
yomomalikebracobama:
@dude
yomomalikebracobama:
@TETSXPREME
 TETSXPREME:
Well lets search up the definition of all the answers and maybe we can figure it out
yomomalikebracobama:
A histogram is an approximate representation of the distribution of numerical data. It was first introduced by Karl Pearson.[1] To construct a histogram, the first step is to "bin" (or "bucket") the range of values—that is, divide the entire range of values into a series of intervals—and then count how many values fall into each interval. The bins are usually specified as consecutive, non-overlapping intervals of a variable. The bins (intervals) must be adjacent and are often (but not required to be) of equal size.[2]
yomomalikebracobama:
An ogive (/ˈoʊdʒaɪv/ OH-jyve) is the roundly tapered end of a two-dimensional or three-dimensional object. Ogive curves and surfaces are used in engineering 9 KB (1,014 words) - 10:25, 28 March 2021
 TETSXPREME:
By knowing the definition of some of them what do you think it is?
yomomalikebracobama:
c
yomomalikebracobama:
nvm thats wrong
yomomalikebracobama:
because ast time i tryed i picked it and got it wrong
 yomomalikebracobama:
histograms look the same as scater plot
TETSXPREME:
I still dont understand the question, Ive never heard of " Pizzaulative pattern"
Join our real-time social learning platform and learn together with your friends!
 natalieee:
who else wants a job in biology? I love biomedical science and want to work with
natalieee:
who else wants a job in biology? I love biomedical science and want to work with
 Twaylor:
Time flies doesn't it? I tried to not be the second squeaky wheel of the household and ended up hurting myself and others severely.
Twaylor:
Time flies doesn't it? I tried to not be the second squeaky wheel of the household and ended up hurting myself and others severely.
 clllaaaaaire:
any tips? the quality isn't the best because I am using this site on my computer
clllaaaaaire:
any tips? the quality isn't the best because I am using this site on my computer
 Midnight97:
Kinda a roleplay story between me and my friend enjoy... Part one Forgive me for all the screenshots.
Midnight97:
Kinda a roleplay story between me and my friend enjoy... Part one Forgive me for all the screenshots.
 StevenisGhost:
what type of song should I make next, and will y'all go check out my new song on
Midnight97:
My drawing sure changed over the years look at these two pictures from 2024 to no
StevenisGhost:
what type of song should I make next, and will y'all go check out my new song on
Midnight97:
My drawing sure changed over the years look at these two pictures from 2024 to no
 EdwinJsHispanic:
"poem" love is So Beautiful to have. But it's so hard to have. At this point I don't know whether its worth the wait Or if it's just millions of miles to re
EdwinJsHispanic:
"poem" love is So Beautiful to have. But it's so hard to have. At this point I don't know whether its worth the wait Or if it's just millions of miles to re
EdwinJsHispanic:
"poem" love is So Beautiful to have. But it's so hard to have. At this point I don't know whether its worth the wait Or if it's just millions of miles to re
EdwinJsHispanic:
"poem" love is So Beautiful to have. But it's so hard to have. At this point I don't know whether its worth the wait Or if it's just millions of miles to re