 UnluckySolaR:
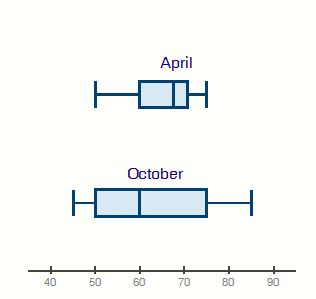
(06.02) The box plots below show the average daily temperatures in April and October for a U.S. city: two box plots shown. The top one is labeled April. Minimum at 50, Q1 at 60, median at 67, Q3 at 71, maximum at 75. The bottom box plot is labeled October. Minimum at 45, Q1 at 50, median at 60, Q3 at 75, maximum at 85. What can you tell about the means for these two months? (1 point) The mean for April is higher than October's mean. There is no way of telling what the means are. The low median for October pulls its mean below April's mean. The high range for October pulls its mean above April's mean.(06.02) The box plots below show the average daily temperatures in April and October for a U.S. city: two box plots shown. The top one is labeled April. Minimum at 50, Q1 at 60, median at 67, Q3 at 71, maximum at 75. The bottom box plot is labeled October. Minimum at 45, Q1 at 50, median at 60, Q3 at 75, maximum at 85. What can you tell about the means for these two months? (1 point) The mean for April is higher than October's mean. There is no way of telling what the means are. The low median for October pulls its mean below April's mean. The high range for October pulls its mean above April's mean.(06.02) The box plots below show the average daily temperatures in April and October for a U.S. city: two box plots shown. The top one is labeled April. Minimum at 50, Q1 at 60, median at 67, Q3 at 71, maximum at 75. The bottom box plot is labeled October. Minimum at 45, Q1 at 50, median at 60, Q3 at 75, maximum at 85. What can you tell about the means for these two months? (1 point) The mean for April is higher than October's mean. There is no way of telling what the means are. The low median for October pulls its mean below April's mean. The high range for October pulls its mean above April's mean.
UnluckySolaR:
@galaxyzstarz Its posted 2 times lol. But can U help?
 GalaxyzStarz:
So, it's just this? The box plots below show the average daily temperatures in April and October for a U.S. city: two box plots shown. The top one is labeled April. Minimum at 50, Q1 at 60, median at 67, Q3 at 71, maximum at 75. The bottom box plot is labeled October. Minimum at 45, Q1 at 50, median at 60, Q3 at 75, maximum at 85. What can you tell about the means for these two months? (1 point) The mean for April is higher than October's mean. There is no way of telling what the means are. The low median for October pulls its mean below April's mean. The high range for October pulls its mean above April's mean.
UnluckySolaR:
Yeah
GalaxyzStarz:
Do you have the box plots?
UnluckySolaR:
Yeah, I can try and take a screenie
 UnluckySolaR:
there ^^
I believe the answer is the mean for April is higher than Octobers mean.
UnluckySolaR:
@galaxyzstarz
GalaxyzStarz:
UnluckySolaR:
1 more?
UnluckySolaR:
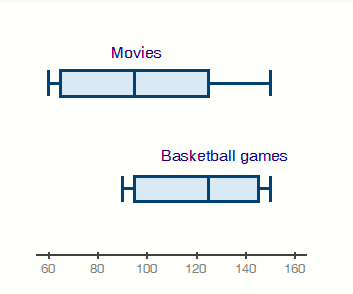
(06.02) The box plots below show attendance at a local movie theater and high school basketball games: two box plots shown. The top one is labeled Movies. Minimum at 60, Q1 at 65, median at 95, Q3 at 125, maximum at 150. The bottom box plot is labeled Basketball games. Minimum at 90, Q1 at 95, median at 125, Q3 at 145, maximum at 150. Which of the following best describes how to measure the spread of the data? (1 point) The IQR is a better measure of spread for movies than it is for basketball games. The standard deviation is a better measure of spread for movies than it is for basketball games. The IQR is the best measurement of spread for games and movies. The standard deviation is the best measurement of spread for games and movies.
 UnluckySolaR:
there is the box plot^^
UnluckySolaR:
@zayne2001
I would say The IQR is a better measure of spread for movies than it is for basketball games.
UnluckySolaR:
That's what i chose but I wasnt sure
the iqr for basket ball was 60 and the iqr for the movies was 90
UnluckySolaR:
alr
UnluckySolaR:
ty
thanks for the medal
UnluckySolaR:
np
UnluckySolaR:
wait 1 more
UnluckySolaR:
(06.02) The box plots below show student grades on the most recent exam compared to overall grades in the class: two box plots shown. The top one is labeled Class. Minimum at 74, Q1 at 78, median at 85, Q3 at 93, maximum at 98. The bottom box plot is labeled Exam. Minimum at 81, Q1 at 85, median at 93, Q3 at 96, maximum at 99. Which of the following best describes the information about the medians? (1 point) The exam median is only 1−2 points higher than the class median. The exam median is much higher than the class median. The additional scores in the second quartile for the exam data make the median higher. The narrower range for the exam data causes the median to be higher.
 UnluckySolaR:
^^ is the box plot
I would say The exam median is much higher than the class median. because the exam median is 93 and the class median is 85.
UnluckySolaR:
thanks
your welcome
i think i can also give you a medal as well
but im no sure
oh i did
Join our real-time social learning platform and learn together with your friends!
 natalieee:
who else wants a job in biology? I love biomedical science and want to work with
natalieee:
who else wants a job in biology? I love biomedical science and want to work with
 Twaylor:
Time flies doesn't it? I tried to not be the second squeaky wheel of the household and ended up hurting myself and others severely.
Twaylor:
Time flies doesn't it? I tried to not be the second squeaky wheel of the household and ended up hurting myself and others severely.
 clllaaaaaire:
any tips? the quality isn't the best because I am using this site on my computer
clllaaaaaire:
any tips? the quality isn't the best because I am using this site on my computer
 Midnight97:
Kinda a roleplay story between me and my friend enjoy... Part one Forgive me for all the screenshots.
Midnight97:
Kinda a roleplay story between me and my friend enjoy... Part one Forgive me for all the screenshots.
 StevenisGhost:
what type of song should I make next, and will y'all go check out my new song on
Midnight97:
My drawing sure changed over the years look at these two pictures from 2024 to no
StevenisGhost:
what type of song should I make next, and will y'all go check out my new song on
Midnight97:
My drawing sure changed over the years look at these two pictures from 2024 to no
 EdwinJsHispanic:
"poem" love is So Beautiful to have. But it's so hard to have. At this point I don't know whether its worth the wait Or if it's just millions of miles to re
EdwinJsHispanic:
"poem" love is So Beautiful to have. But it's so hard to have. At this point I don't know whether its worth the wait Or if it's just millions of miles to re
EdwinJsHispanic:
"poem" love is So Beautiful to have. But it's so hard to have. At this point I don't know whether its worth the wait Or if it's just millions of miles to re
EdwinJsHispanic:
"poem" love is So Beautiful to have. But it's so hard to have. At this point I don't know whether its worth the wait Or if it's just millions of miles to re